Engineering metrics
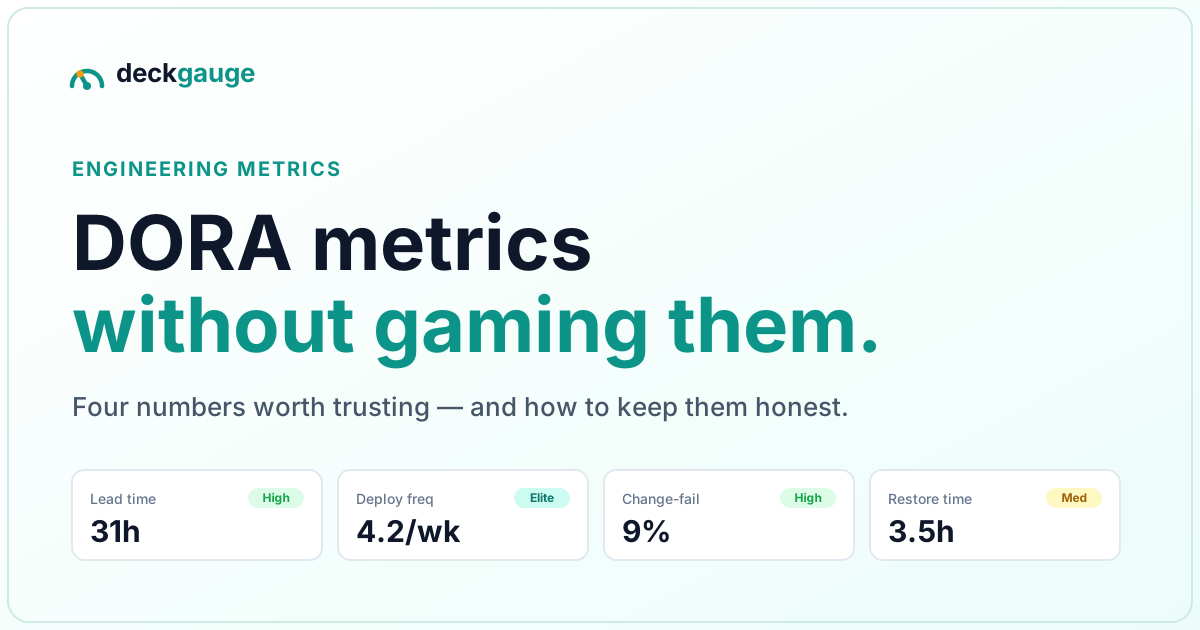
DORA metrics without gaming them
The short version.
- Every DORA key has an obvious exploit, and teams under pressure find all of them.
- Reading the four as a set is the main defence — gaming one shows up as a contradiction in another.
- Keep them at team level. A DORA number in a performance review destroys the data it measures.
- Label proxies as proxies. A metric nobody trusts is worse than no metric.
- Use them to start a question, not to settle a score.
The four DORA metrics — deployment frequency, lead time for changes, change failure rate, and time to restore service — are the closest thing our industry has to a shared language for delivery. They are also dangerously easy to game. The moment a number becomes a target on someone's review, people optimise the number instead of the outcome. That is Goodhart's law, and it quietly ruins most metrics programmes. Here is how to get the value of DORA without the theatre.
How each metric gets gamed
Worth being specific, because these are not hypothetical — they are what actually happens within a quarter of attaching a target to any of them.
| Metric | The exploit | What it looks like in the data |
|---|---|---|
| Deployment frequency | Split one change into ten trivial deploys | Deploy count rises while delivered items stay flat |
| Lead time for changes | Slice pull requests until review is meaningless | Lead time falls while PR size collapses and comment rate drops |
| Change failure rate | Stop logging incidents, or reclassify them | Failure rate falls with no corresponding drop in rework rate |
| Time to restore | Close incidents before they are actually fixed | Restore time falls while repeat incidents rise |
Notice that in every row the dashboard turns green while delivery gets worse. That is the signature of a gamed metric, and it is why the third column matters more than the second — you cannot police intent, but you can watch for the tell.
Measure the four together, never one alone
DORA works because the metrics are in tension. Throughput (frequency, lead time) is balanced by stability (change failure, restore time) — you cannot safely juice one without the others moving. Looked at as a set, gaming shows up as a contradiction: deploy frequency spikes while change failure climbs.
This is why the DORA dashboard shows all four side by side with Elite, High, Medium and Low tiers rather than collapsing them into a single vanity score. A composite "delivery score" is precisely the thing that makes gaming invisible, because it lets an improvement in one term hide a regression in another.
A practical habit: never quote one DORA metric in isolation, in a deck or in a meeting. If lead time improved, say what happened to change failure rate in the same breath. It takes four extra words and it makes the claim honest.
Keep it at the team level
DORA was designed to measure systems and teams, not individuals. Tie it to a person's performance review and you have built an incentive to game it, plus a reason for that person to hide problems from you.
There is a second reason beyond incentives: no individual can move these numbers on their own. Lead time is a property of how work is batched, reviewed and released. Change failure rate is a property of testing and deploy tooling. Holding one engineer accountable for a structural property of the delivery system is unfair and, more practically, useless — the accountability is pointed at someone with no lever to pull. We go into what responsible individual-level measurement does look like in measuring engineers without surveillance.
Be honest about proxies
Most tools quietly fudge the metrics they cannot truly measure. If you have not connected a deployment or incident source, "deployment frequency" and "time to restore" are inferred from merges and issue activity — often directionally useful, but not measurements.
Deckgauge labels those as proxies on the widget rather than overstating precision. This is not modesty for its own sake. The first time an engineer works out that a confidently-presented number was an estimate all along, you lose the argument and the tool's credibility at the same time, and you do not get either back. Honest numbers are the whole point; a metric you do not trust is worse than no metric.
The corollary: lead time for changes is the key most tools can measure directly, from first commit to merge. If you are only going to trust one, trust that one — and go connect a deployment source if you want the other two to be real.
Look underneath the number
DORA tells you the outcome. It almost never tells you the cause, and teams that stop at the four keys end up staring at a red tile with no idea what to do.
When lead time drifts upward, the cause is usually one of three things, and all three are measurable: pull requests got larger (PR size distribution), first review got slower (review pickup time), or the team started more work than it finished (work in progress). Checking those three converts "our DORA got worse" into a specific thing you can change on Monday.
Similarly, a change failure rate that looks suspiciously good is worth cross-checking against rework rate. If failures are down but the share of commits rewriting recent code is up, the failures did not stop — they stopped being recorded as failures.
Use it as a conversation, not a scoreboard
The healthiest teams treat DORA as a prompt: "lead time jumped last sprint — what changed?" rather than "you are Medium, fix it." Trends and questions beat rankings and targets every time.
Two habits that make this concrete. First, put the four keys in a retro rather than a status report — a retro produces hypotheses, a status report produces defensiveness. Second, when a number moves, ask the team what they think caused it before offering your own theory. They usually know, and asking is what keeps the metric something the team owns rather than something being done to them.
And if you are choosing a tool to do this with, the criterion that matters most is whether you can read how each number is calculated — see self-hosted DORA metrics: the open-source options.
Frequently asked
- How do teams game DORA metrics?
- Each key has an obvious exploit. Reward deployment frequency and one change becomes ten trivial deploys. Reward short lead time and pull requests get sliced past the point where review is meaningful. Punish change failure rate and incidents stop being logged. Chase time to restore and incidents get closed before they are fixed. In every case the dashboard turns green while delivery gets worse.
- Why should DORA metrics never be tied to performance reviews?
- DORA was designed to measure delivery systems and teams, not individuals. Attaching it to someone pay or rating creates a direct incentive to manipulate it, and the manipulations are easy and invisible. You lose the data and gain nothing, because the underlying delivery problem is structural and no individual can fix it by trying harder.
- Can you game all four DORA metrics at once?
- Not easily, and that is the point. The four are in tension: throughput metrics are balanced by stability metrics, so juicing one tends to move another the wrong way. Gaming shows up as a contradiction — deployment frequency spiking while change failure rate climbs. This is why reading the four as a set is a defence rather than just good practice.
- What is a proxy metric in DORA, and does it matter?
- If no deployment or incident source is connected, deployment frequency and time to restore have to be inferred from merges and issue activity rather than measured. That inference is often directionally useful but it is not a measurement, and a tool that presents it as one is overstating its precision. Deckgauge labels affected metrics as proxies.
- What should you do when a DORA metric moves the wrong way?
- Treat it as a prompt, not a verdict. Check the other three first, because the interesting information is usually in the combination. Then look at the flow and review metrics underneath — a rising lead time is far more often caused by larger pull requests or slower first review than by anyone coding more slowly.