Writing on engineering intelligence.
Practical writing on engineering intelligence, DORA done right, and reading a team’s delivery — from the CTO-as-a-service team that builds Deckgauge.
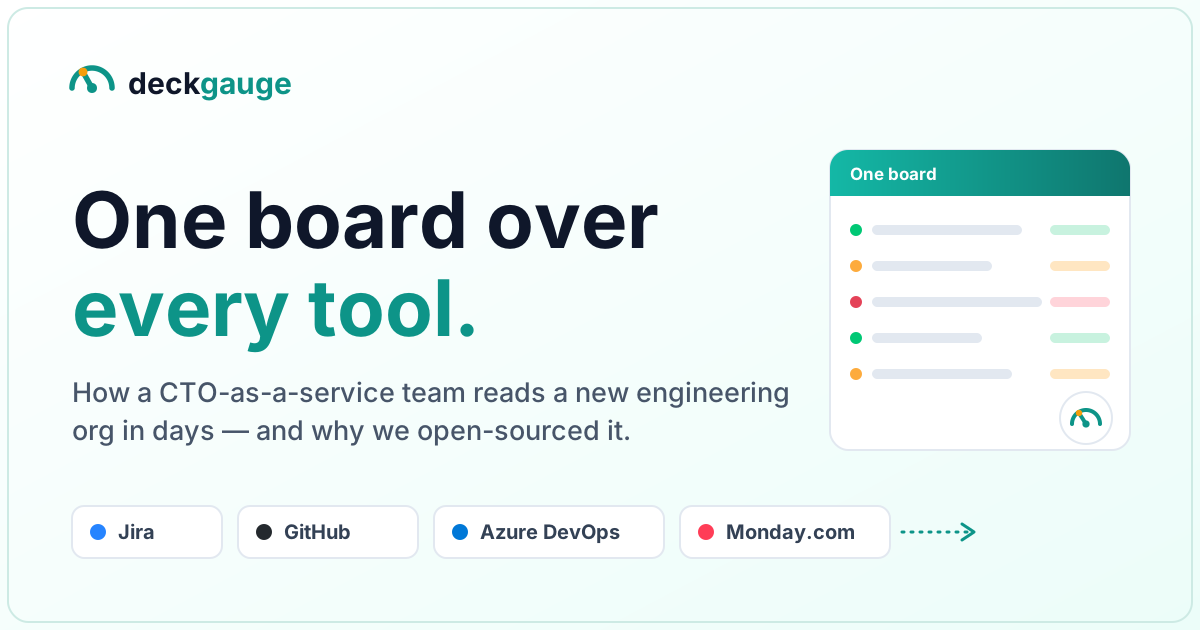
Why we built Deckgauge — and why we’re giving it away
CodPal built Deckgauge to step into any company as a fractional CTO and understand delivery fast — one board over Jira, GitHub, Azure DevOps and Monday.com, the real bottlenecks, and a roadmap for leadership. Here’s the story, and why its source is now public.
Read more →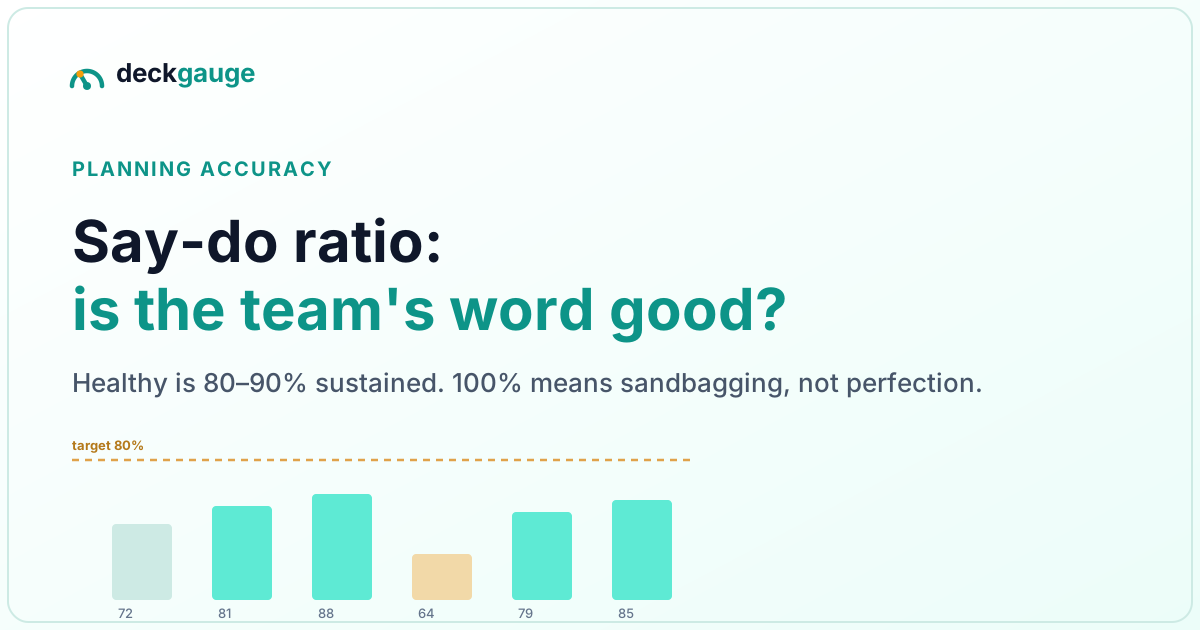
Say-do ratio: how to calculate it, chart it, and read it honestly
The say-do ratio measures whether a team’s sprint commitments are reliable. How to calculate it from Jira or Azure DevOps, what a good number is (80–90%, not 100%), and how to chart it without turning it into surveillance.
Read more →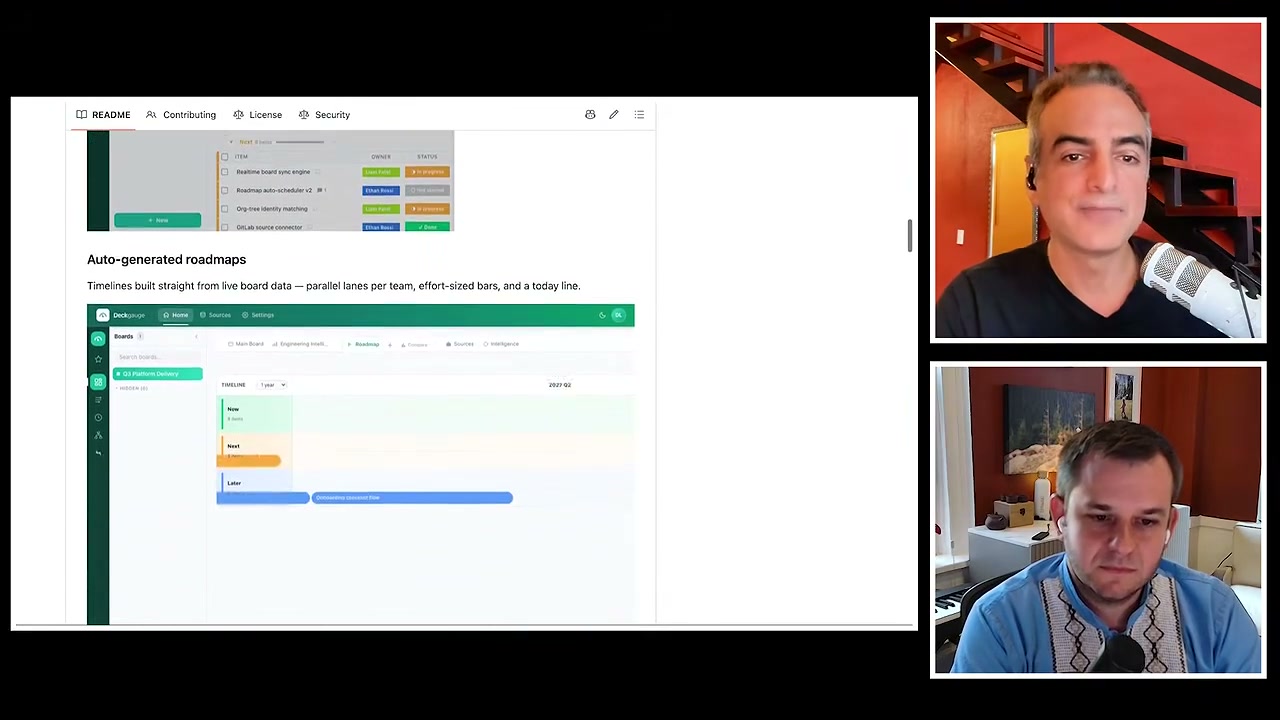
Why not just use Jira? Answering Andrew Warner’s question
Deckgauge was on The Next New Thing, and Andrew Warner asked the question every engineering leader asks: why not put everything in Jira? The full answer — Jira records the ticket, not the delivery — with the video segment.
Read more →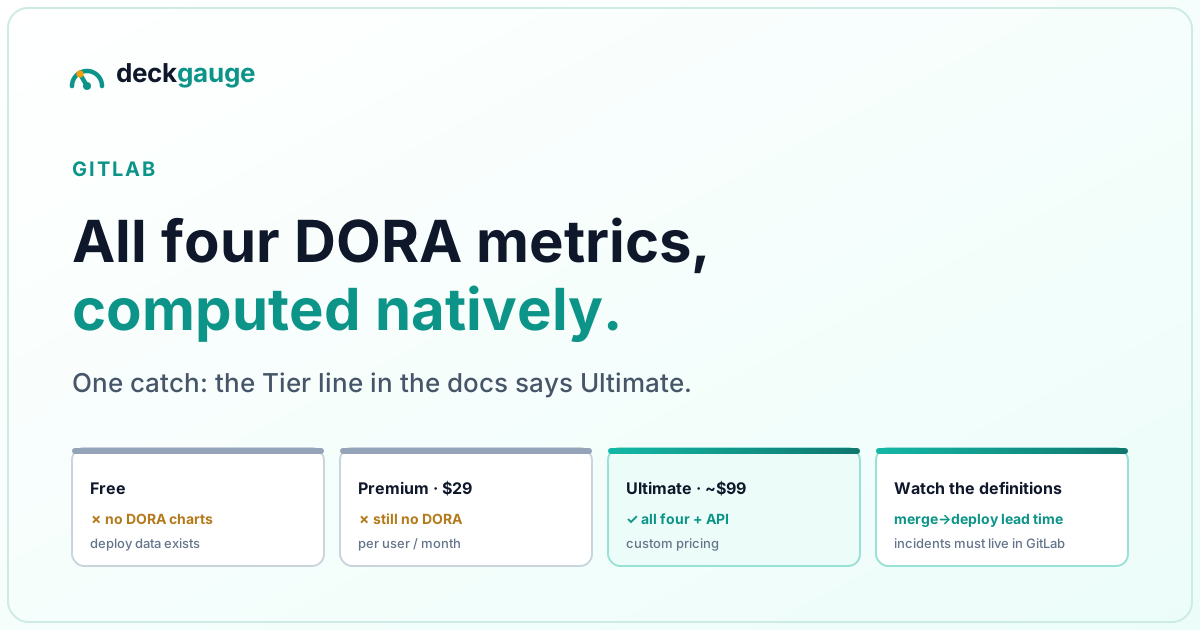
DORA metrics in GitLab: what you get, what it costs, and what it quietly assumes
GitLab is the only tracker that computes all four DORA metrics natively — behind the Ultimate tier. What Free and Premium actually get, the lead-time definition to watch, and the incident rule the charts assume.
Read more →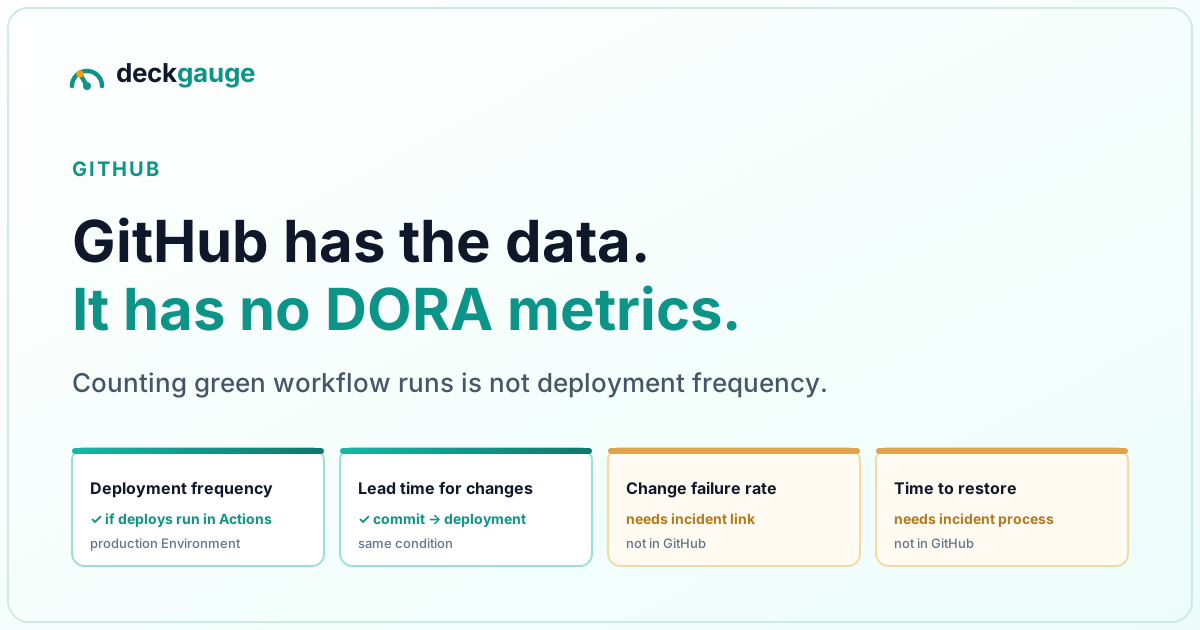
DORA metrics from GitHub: what GitHub gives you, and what it doesn’t
GitHub holds commits, pull requests and Actions runs — and computes none of the four DORA metrics. Which two you can derive when deploys run through Actions, which two need an incident signal, and the honest options for a GitHub DORA dashboard.
Read more →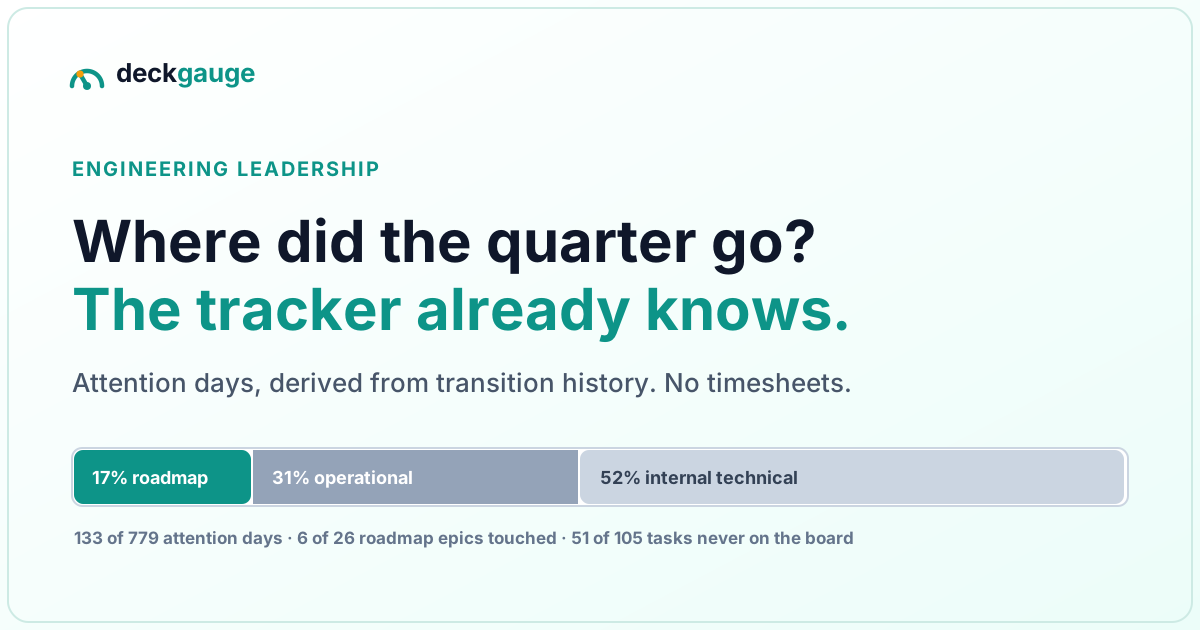
Where did the engineering quarter actually go?
Leadership asks what a quarter of engineering bought, and flow metrics cannot answer it — they all divide by the ticket. How to derive a roadmap-share figure from transition history you already have, the parked-work trap that distorts it, and the four guards that stop it becoming a performance review.
Read more →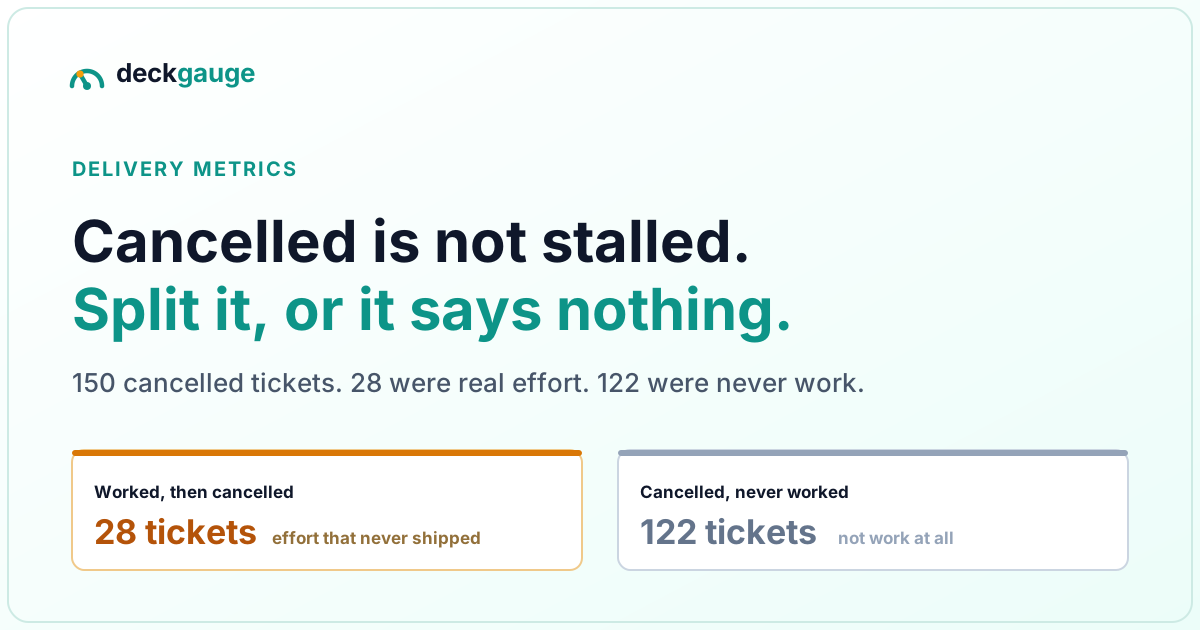
Cancelled tickets are a process metric, not a mess
On one board, 150 cancelled tickets were filling 46% of the backlog bar — and the 28 that had actually been worked on were invisible. Why cancelled work needs its own delivery stage, how to measure the effort behind it, and why making it a team target backfires.
Read more →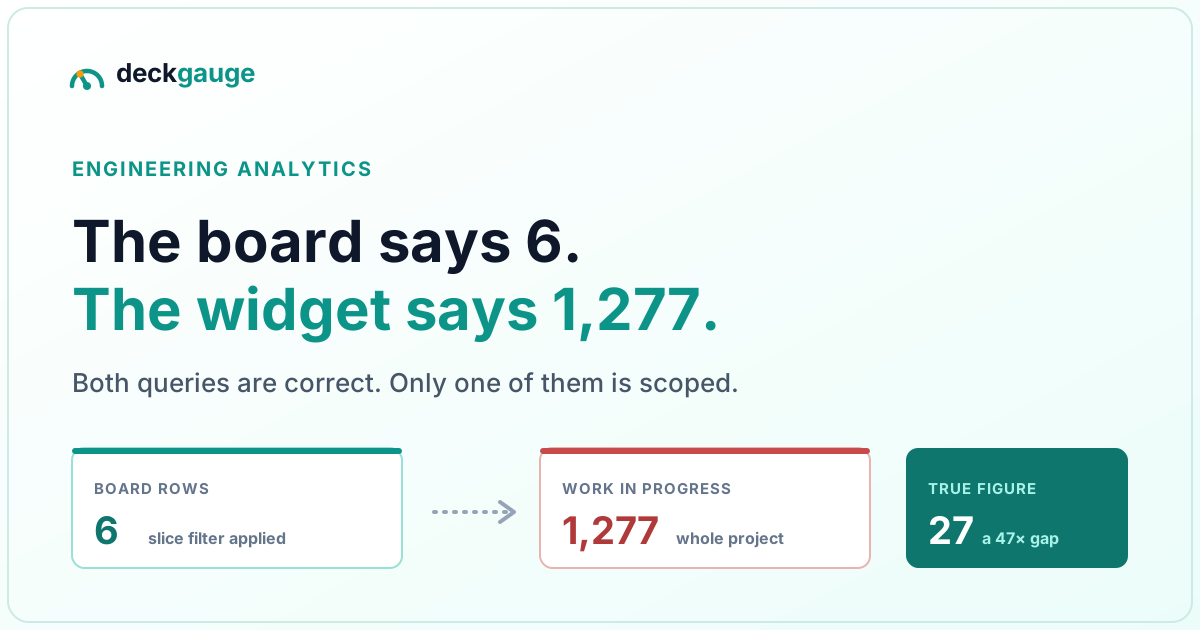
Why your work-in-progress number is 47× too high
A board showed 6 rows; its Work in Progress widget showed 1,277. The widget was right about its own query. A board carries two scopes — the connection and the slice — and analytics pipelines routinely carry only the first. How to spot it, and the Azure DevOps trap on top of it.
Read more →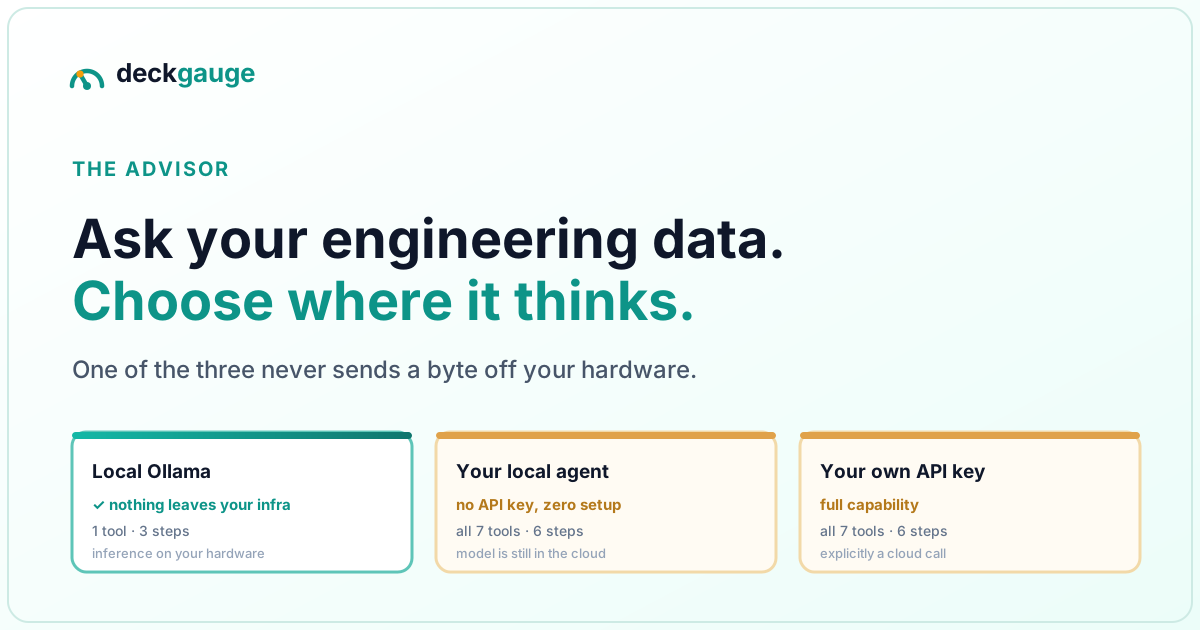
Ask your engineering data questions — with an AI that runs on your own machine
The Advisor answers questions about one board using real, grounded data. Three ways to give it a model — a fully local Ollama instance, the Claude Code or Codex already signed in on your machine, or your own API key — and the honest trade-off between privacy and capability.
Read more →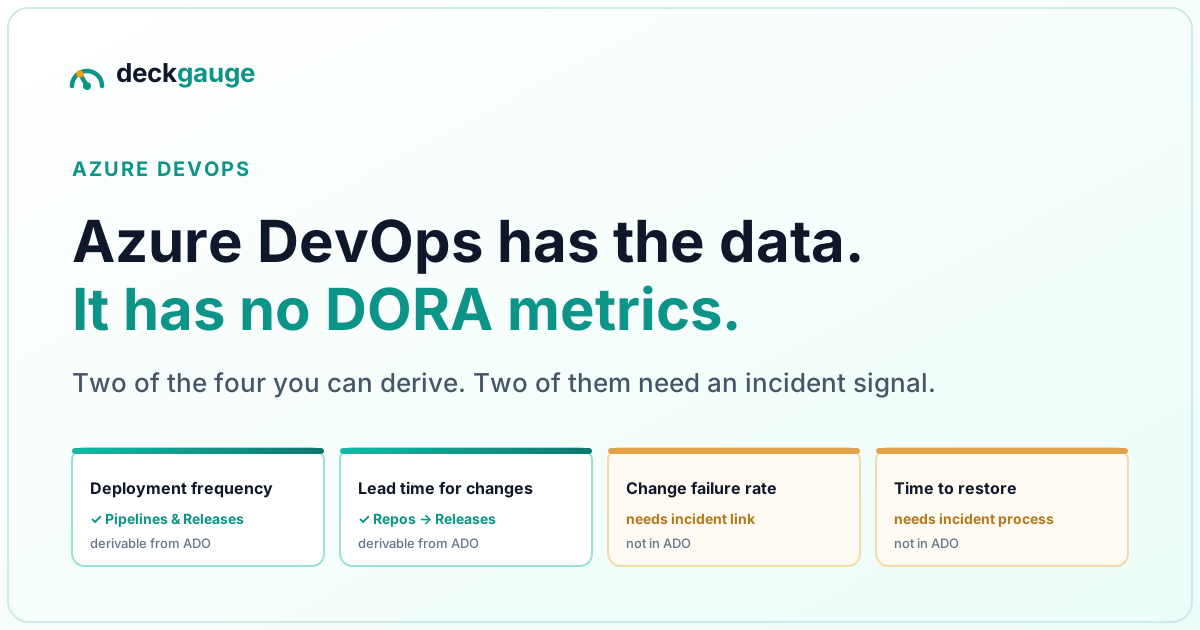
DORA metrics for Azure DevOps: what ADO gives you, and what it doesn't
Azure DevOps holds Repos, Pipelines, Releases and Boards — and computes none of the four DORA metrics. Which two you can derive cleanly from ADO data, which two need an incident signal it does not record, and why so many dashboards quietly substitute pipeline failure rate for change failure rate.
Read more →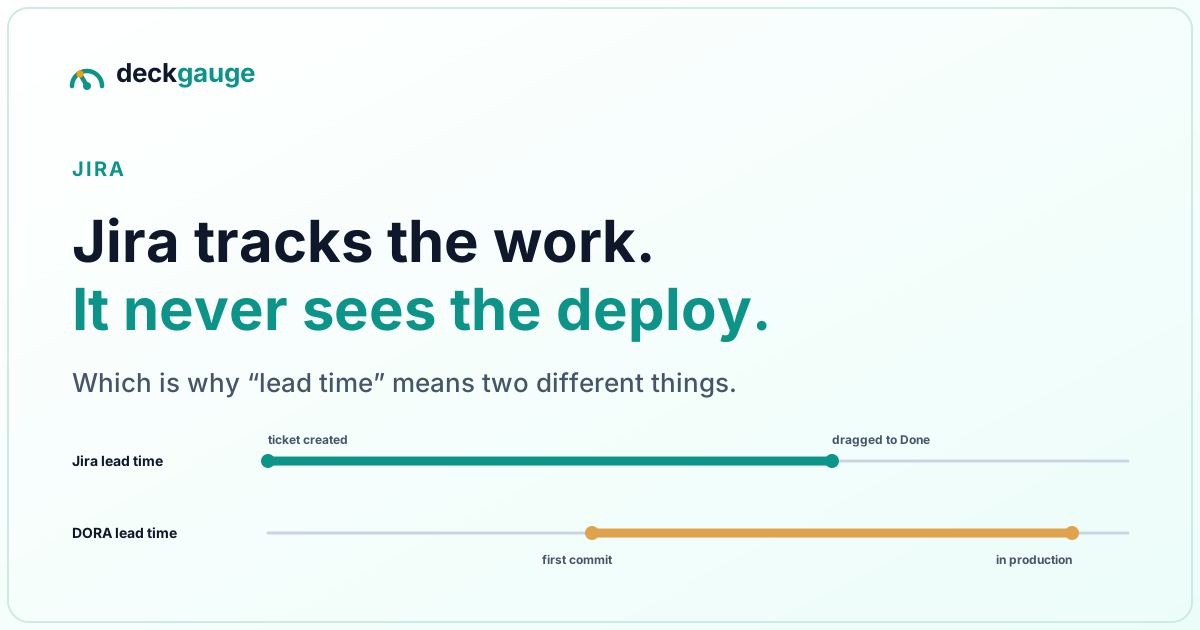
Can you get DORA metrics from Jira? An honest accounting
Jira records no deployment reaching production, so two of the four DORA metrics are structurally out of reach from Jira alone. What you can measure, why “lead time” means two different things, and the queue data Jira is genuinely the best source for.
Read more →
Open-source Jellyfish and LinearB alternative: a full comparison
Jellyfish and LinearB are strong engineering-intelligence platforms with per-seat pricing and your data in their cloud. A feature-by-feature comparison against Deckgauge — DORA, flow, investment allocation, pricing, self-hosting effort — and an honest account of where the paid tools still win.
Read more →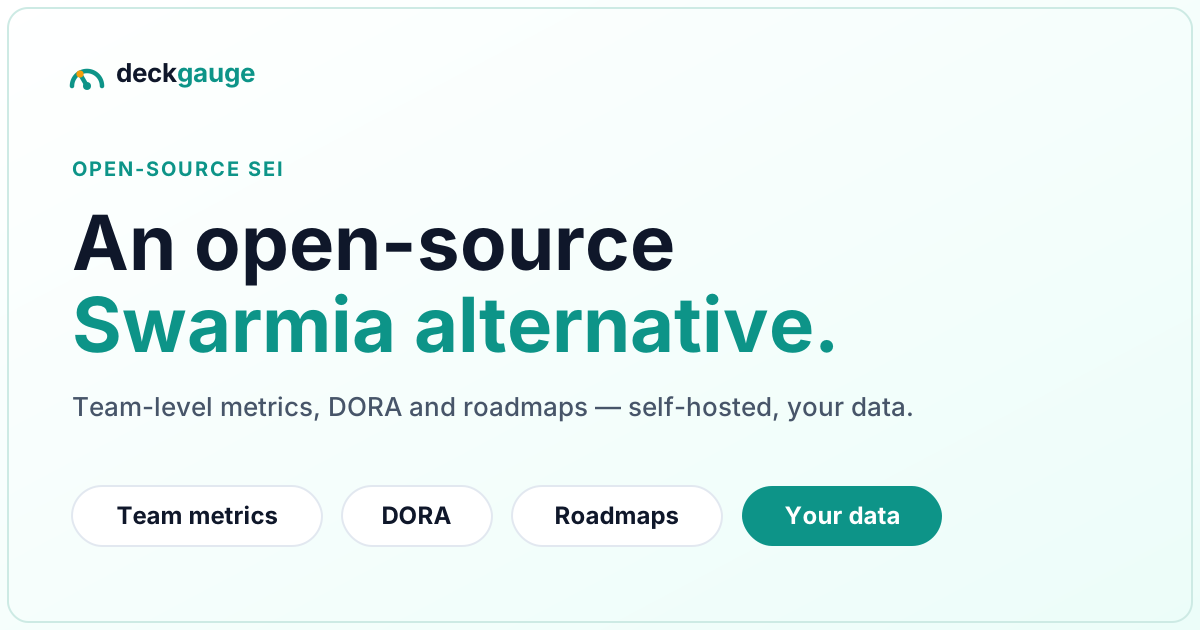
Open-source Swarmia alternative: how Deckgauge compares
Swarmia is the benchmark for team-level developer-experience metrics, and it is SaaS. A detailed comparison with Deckgauge — what maps one-to-one, what does not exist on either side, pricing at 25 and 100 engineers, and how to run a two-week trial before you commit.
Read more →
Apache DevLake vs Deckgauge: a database or a product
Apache DevLake is excellent open-source data plumbing, and then you build the dashboards yourself in Grafana. A concrete comparison of what each one gives you on day one, what setup actually costs in hours, and which of the two you should pick.
Read more →
Self-hosted DORA metrics: the open-source options
Want DORA metrics without a SaaS holding your data? An honest look at the self-hosted, open-source options — Apache DevLake, Middleware and Deckgauge — and how to choose.
Read more →
How to measure engineering productivity: the metrics that hold up
Which metrics actually reflect engineering productivity (DORA, flow, review), which mislead, and how to measure teams without surveilling individuals.
Read more →
DORA metrics without gaming them
The four DORA metrics are only useful if teams don’t game them. How to measure deployment frequency, lead time, change-failure rate and restore time honestly — at team level, as a conversation, not a scoreboard.
Read more →
Measuring engineers without surveillance
Engineering metrics don’t have to mean surveillance. Measure delivery supportively — team aggregates, finding who needs a hand instead of who to punish, and individual figures treated as decision support rather than a rating.
Read more →
How to actually prove your Copilot ROI
Copilot seats cost real money, and acceptance rate doesn’t prove ROI. Measure AI coding-assistant value with delivery data: AI-assisted PR share, throughput and cycle-time deltas, with quality guardrails.
Read more →Prefer a reader? Subscribe to the RSS feed.