Self-hosted SEI
Apache DevLake vs Deckgauge: a database, or a product
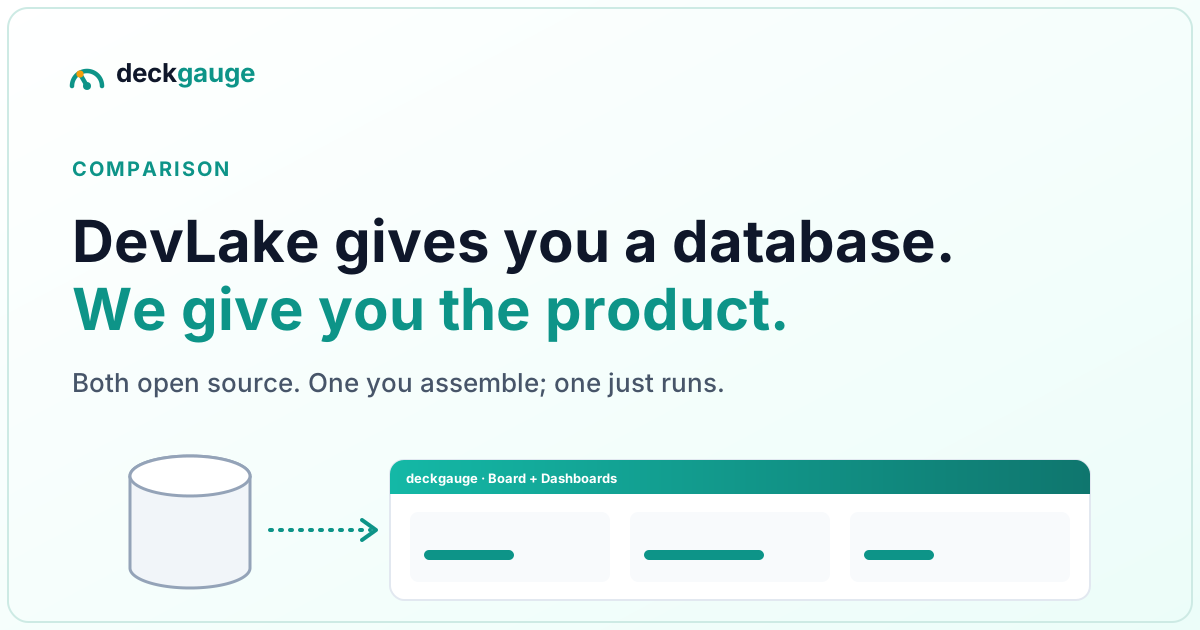
The short version.
- Both are free and self-hosted; DevLake is Apache-2.0 open source, Deckgauge is source-available (FSL-1.1). Neither charges per developer. This is not a cost comparison.
- DevLake is infrastructure: it ingests and normalises engineering data into a database, with Grafana as the dashboard layer.
- Deckgauge is an application: ingestion plus boards, roadmaps, org trees and interpreted metric widgets, out of the box.
- The real question is not which is better — it is whether you want to own the data model or open a working product.
They are not competing for the same job
Most comparisons in this category are two products fighting over one slot. This one is not, and pretending otherwise would waste your time.
Apache DevLake solves the ingestion problem. Getting Jira, GitHub, GitLab, Azure DevOps, Jenkins and the rest into one coherent schema is genuinely hard, tedious work — every provider models issues differently, every API paginates and rate-limits differently, and the normalisation has a hundred edge cases. DevLake does that job well, under an Apache Foundation governance model, and it does it for more source systems than we support.
What you get at the end is a well-modelled database and a set of Grafana dashboards. Which is exactly right if a database is what you wanted.
Deckgauge solves the last mile. The ingestion is table stakes; the product is what happens after. Widgets that state what they measure and how to act on them, boards you can run a leadership meeting from, roadmaps, org trees, and a CapEx/OpEx report. The assumption is that you do not want to build a dashboard layer — you want to open something and see the answer.
The honest comparison
| Apache DevLake | Deckgauge | |
|---|---|---|
| Shape | Data pipeline + warehouse | Application |
| Licence | Apache 2.0 | Functional Source License (source-available) |
| Governance | Apache Software Foundation | Single vendor (CodPal) |
| Cost | Free | Free (Community) |
| Source connectors | Broader — includes CI systems, Bitbucket, TAPD and more | Jira, GitHub, GitLab, Azure DevOps, Microsoft Graph, calendar |
| Dashboard layer | Grafana — you own and customise it | Purpose-built widgets, no Grafana needed |
| Time to a tailored DORA view | Days to weeks (dashboard + SQL work) | Hours (status mapping in the UI) |
| Metric interpretation guidance | Left to you | A page per widget — what it means, how it misleads, what to do |
| Boards / work management | No | Yes — Monday-style, over synced sources |
| Gantt roadmaps | No | Yes |
| Org tree & per-engineer views | No | Yes |
| CapEx/OpEx with cost layer | No | Yes |
| Own the data model | Yes — its main advantage | Partially; ClickHouse is yours but the schema is ours |
| Feed other consumers (BI, warehouse) | Yes — designed for it | Via the REST API and MCP server |
What "you build the dashboards" actually costs
DevLake ships pre-built Grafana dashboards, including DORA ones, so it is unfair to suggest you start from nothing. The cost is not in getting a first chart on screen — it is in making that chart true for your organisation.
Every team's data needs the same set of decisions before a metric means anything. Which Jira statuses count as in-progress? Which issue types are bugs versus tech debt? Is a "deployment" a tag, a release, or a merge to main? Which repositories belong to which team? Does a PR approved by a bot count as reviewed?
With DevLake, each of those answers lives in dashboard SQL that somebody has to write, and then maintain when the workflow changes — and workflows change constantly. With Deckgauge those decisions are UI concerns: a status-mapping editor per provider, an in-progress statuses screen, per-repo intelligence toggles. Same decisions, different place, and a place a delivery lead can reach without a SQL editor.
The maintenance question is the one people underestimate. A Grafana dashboard built against a normalised schema is a piece of software your team now owns. It has no tests, one author, and it breaks quietly when a workflow changes. Ask honestly who will own it in eighteen months.
Where DevLake is the better choice
This is not a formality — there are several situations where we would pick DevLake.
- You want engineering data in a warehouse. If the goal is joining delivery data to support tickets, revenue, or headcount from other systems, DevLake's normalised database is exactly the right primitive and Deckgauge is the wrong shape entirely.
- You have data engineering capacity and strong opinions. If your definition of cycle time is genuinely specific to your business, owning the SQL is a feature, not a cost.
- You need a connector we do not have. DevLake's plugin ecosystem is broader, particularly for CI systems and less common trackers.
- Foundation governance matters to you. DevLake is an Apache project. Deckgauge is maintained by one company, and for some organisations that difference is decisive on its own. That is a reasonable position.
Where Deckgauge is the better choice
- You need this working this week. Four commands to a running stack, then connect a source. See the quickstart.
- The audience is leadership, not analysts. A VP is not going to browse Grafana. They will open a board, look at the roadmap, and ask why an initiative is red.
- You want interpretation, not just numbers. Every widget has a documentation page explaining what it measures, where the data comes from, how it can mislead you, and the managerial action it implies. That guidance is the actual product for most teams.
- You want work management in the same place. Boards, roadmaps and org trees sit next to the analytics, so the meeting and the metrics are the same surface.
- You need capitalisation numbers. The CapEx/OpEx report infers hours from status history and applies a blended rate — no timesheets, and nothing equivalent ships with DevLake.
You can run both
These are not mutually exclusive, and for a larger organisation running both is a coherent architecture: DevLake as the warehouse feeding BI and finance, Deckgauge as the day-to-day surface engineering leadership actually opens. They read the same source systems with read-only credentials, so there is no conflict in doing so — just double the ingestion load on your provider rate limits, which is worth planning for.
Frequently asked
- What is the difference between Apache DevLake and Deckgauge?
- DevLake is a data pipeline: it ingests from Jira, GitHub, GitLab, Azure DevOps and others, normalises everything into a shared schema in a database, and ships Grafana dashboards over the top. Deckgauge is a finished application: the same ingestion, plus purpose-built boards, roadmaps, org trees and metric widgets with an opinionated interpretation layer. DevLake gives you the data model to build on; Deckgauge gives you the product to open.
- Is Apache DevLake free?
- Yes. DevLake is an Apache Software Foundation project under the Apache 2.0 licence, self-hosted via Docker or Helm. Deckgauge Community is also free, source-available under the Functional Source License. Neither charges per developer.
- Which is faster to get a DORA dashboard from?
- Deckgauge, in most cases. DevLake ships pre-built Grafana dashboards including DORA, so a default view is achievable quickly, but adapting them to your workflow states, issue types and definitions of done is where the real time goes. Deckgauge maps statuses through a UI editor and renders its widgets directly, so the customisation happens in the app rather than in dashboard JSON and SQL.
- Can I use DevLake as the pipeline and something else as the UI?
- Yes, and that is a legitimate architecture — DevLake normalises into a database you can query with anything. It is the right choice when you want a warehouse of engineering data feeding several consumers, or when you need to join engineering data to business data DevLake does not know about.
- Which should I choose?
- Choose DevLake if you have data engineering capacity, want to own the data model, or need engineering data in a warehouse alongside other sources. Choose Deckgauge if you want DORA, flow, review analytics, roadmaps and org views working this week without building a dashboard layer first.
If you are surveying the whole field, the broader write-up is self-hosted DORA metrics: the open-source options. For the commercial side, see the Jellyfish and LinearB comparison.