AI adoption
How to actually prove your Copilot ROI
The short version.
- Acceptance rate measures whether developers press Tab. It is an input metric and it cannot carry an ROI argument.
- Measure adoption and outcomes separately, then look for the relationship between them.
- Outcomes worth measuring: throughput, cycle time, review pickup time. Guardrails: rework rate, change failure rate, review quality.
- Compare quarters, not weeks, and compare adopters to non-adopters rather than only before to after.
- Be prepared for a null or negative result. That is still worth far more than the invoice told you.
Your finance team approved a stack of GitHub Copilot seats, the renewal is coming, and someone wants to know what they bought. The honest answer for most organisations is "we are not sure" — because the number everyone quotes, suggestion acceptance rate, measures whether developers press Tab, not whether the business ships more.
Why acceptance rate is a vanity metric
Acceptance rate tells you the tool is being used. It does not tell you it created value. Accepted suggestions get rewritten, deleted, or reverted; a high acceptance rate is perfectly compatible with no change in delivery at all, and can even correlate with churn, because code that arrives fast and unconsidered gets redone.
It fails as a business metric for a more basic reason too: you cannot construct a counterfactual from it. "Developers accepted 130,000 suggestions" does not become a statement about output no matter how you multiply it. Any attempt to convert it into saved hours requires assuming a value per suggestion, and that assumption is doing all of the work.
Treat acceptance rate as what it is — a rollout-health signal, useful for spotting a team that has licences and is not using them. Then go and measure something else.
Step 1: measure adoption you can actually defend
Start with a delivery-side adoption signal rather than a vendor dashboard: the share of merged pull requests and commits that carry an AI-assist marker, tracked over time. Deckgauge measures both, separately — AI-assisted PR percentage and bot versus human commits — and shows them together on the AI adoption widget.
Two numbers rather than one, because they disagree in informative ways. High PR share with low commit share generally means AI is drafting descriptions and summaries rather than writing the code. The reverse means heavy in-editor use that never gets marked at the PR level. Either way, the gap tells you more about how the tool is actually being used than a single blended figure.
The asterisk you must state up front. Marker-based detection only sees assistants that write a trailer. If a team uses a tool that does not, they read as zero. A low adoption number is never evidence AI was not used — it is a prompt to go and check tooling configuration. Say this in the meeting before someone else finds it, because a metric that gets undermined halfway through a presentation takes the whole argument with it.
Step 2: connect adoption to delivery
This is the step everyone skips, and it is the only one that produces an ROI argument. You need two comparisons, not one.
Before and after tells you whether delivery changed around the rollout. On its own it is weak, because everything else changed too — you hired, you reorganised, a big project landed.
Adopters versus non-adopters is the stronger comparison, because both groups lived through the same quarter, the same freezes and the same incidents. If the teams leaning into Copilot moved and the teams that did not stayed flat, you have something that survives scrutiny. Run both and see whether they agree.
The outcome metrics worth using, in order of usefulness:
| Metric | Why it belongs in an ROI case |
|---|---|
| Cycle time | The most direct translation of "we ship faster" into a number. Measured creation to done, so it captures waiting as well as working. |
| Lead time for changes | First commit to merge, measured directly rather than proxied. Narrower than cycle time and therefore harder to argue with. |
| Throughput | Volume delivered. Necessary, but never sufficient on its own — volume rises when work is sliced smaller, which is not the same as delivering more. |
| Review pickup time | The sleeper. If AI increases output without review capacity increasing, this is where the gain gets absorbed — and it will show up here first. |
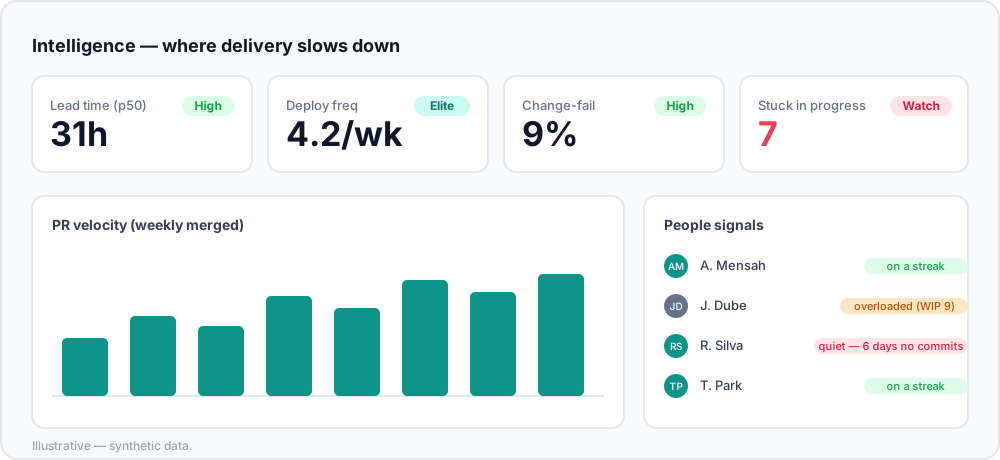
The period comparison widget is built for exactly this shape of question: it contrasts six delivery and quality KPIs across two adjacent 90-day windows and grades each Improved, Regressed or Flat, then lets you drill in to check whether a verdict is a real trend or one distorting period.
Step 3: guard the quality side
Speed that creates rework is not ROI, it is displaced cost. Three guardrails belong next to every adoption chart:
- Rework rate — the share of commits rewriting code changed in the last 21 days. If AI-heavy teams are shipping faster and this is climbing, you are paying for volume rather than progress.
- Change failure rate, on the DORA dashboard — whether more of what ships needs fixing.
- Review quality — the one most people forget. More code arriving at the same reviewers reliably produces faster, thinner review. Watch approval coverage, instant-merge rate and comment rate, because a rising instant-merge rate alongside rising AI adoption is the clearest early warning there is.
If AI-heavy teams are shipping faster and holding quality, that is the whole case, and it is a strong one. If quality slips, you have learned something a licence invoice never told you. This pairs naturally with reading DORA metrics without gaming them.
A measurement protocol you can run
Concretely, if you have a renewal decision in six weeks:
- Fix detection first. Confirm your assistants write an AI-assist trailer. If they do not, everything downstream reads zero and you will draw the wrong conclusion.
- Split the population. Identify which teams genuinely adopted and which did not, from the adoption data rather than from licence assignment. Seats issued is not usage.
- Pick two 90-day windows — one before rollout, one after — and avoid straddling a reorganisation or a freeze if you possibly can.
- Pull the four outcome metrics and the three guardrails for both groups across both windows. That is a 2×2 you can put on one slide.
- Write down what would change your mind before you look. This is the step that separates measurement from motivated reasoning, and it is the step that makes the result credible to a sceptical CFO.
What an honest negative result looks like
It is worth naming, because teams under pressure to justify a purchase tend not to plan for it. The common negative pattern is: adoption climbing steadily, cycle time flat, rework rate up, review pickup time up. The reading is that AI is generating more code and the delivery system is absorbing the extra volume in review and rework rather than converting it into throughput.
That is not automatically an argument for cancelling seats. More often it is an argument for fixing the constraint the extra output just exposed — pull request size and review capacity — and re-measuring next quarter. The tool did not fail; it moved the bottleneck somewhere you were not looking. Being able to say that with evidence is worth considerably more than a green acceptance-rate dashboard.
Frequently asked
- How do you measure GitHub Copilot ROI?
- Compare delivery outcomes before and after rollout, and between adopters and non-adopters, on throughput, cycle time and review pickup time — then check quality held by watching rework rate, change failure rate and review quality over the same window. Adoption is measured separately, as the share of merged pull requests and commits carrying an AI-assist marker. Acceptance rate is not part of it.
- Why is Copilot acceptance rate a bad ROI metric?
- Acceptance rate measures whether developers press Tab. Accepted suggestions get rewritten, deleted or reverted, so a high acceptance rate is compatible with no delivery improvement at all and can even correlate with churn. It is an input metric describing tool usage, not an outcome metric describing business value.
- How long do you need to measure before the numbers mean anything?
- At least one full quarter after rollout, compared against the equivalent quarter before, and ideally two. Shorter windows are dominated by the things that actually move delivery week to week — holidays, one large release, a reorganisation, an incident. A four-week before-and-after comparison will produce a number, and that number will not be about Copilot.
- What if adoption looks low in the data?
- Check tooling configuration before concluding anything. AI-assist detection depends on a marker being present in a commit trailer or pull request, and assistants that do not write one are invisible. A low reading is never proof AI was not used, which is also why acceptance-rate dashboards from the vendor and delivery-side adoption figures often disagree.
- What does a negative result look like, and what do you do with it?
- Adoption rising while cycle time is flat and rework rate is climbing. That is a real finding worth having: it usually means AI is generating volume that review and rework absorb rather than shortening delivery. The action is not necessarily cancelling seats — it is usually tightening review practice and pull request size first, then re-measuring.
Deckgauge is source-available and runs on your own data, so the ROI numbers are yours to verify rather than ours to assert. Deploy it free, or book a Health Check and we will help you build the before-and-after case.