Delivery metrics
Cancelled tickets are a process metric, not a mess
The short version.
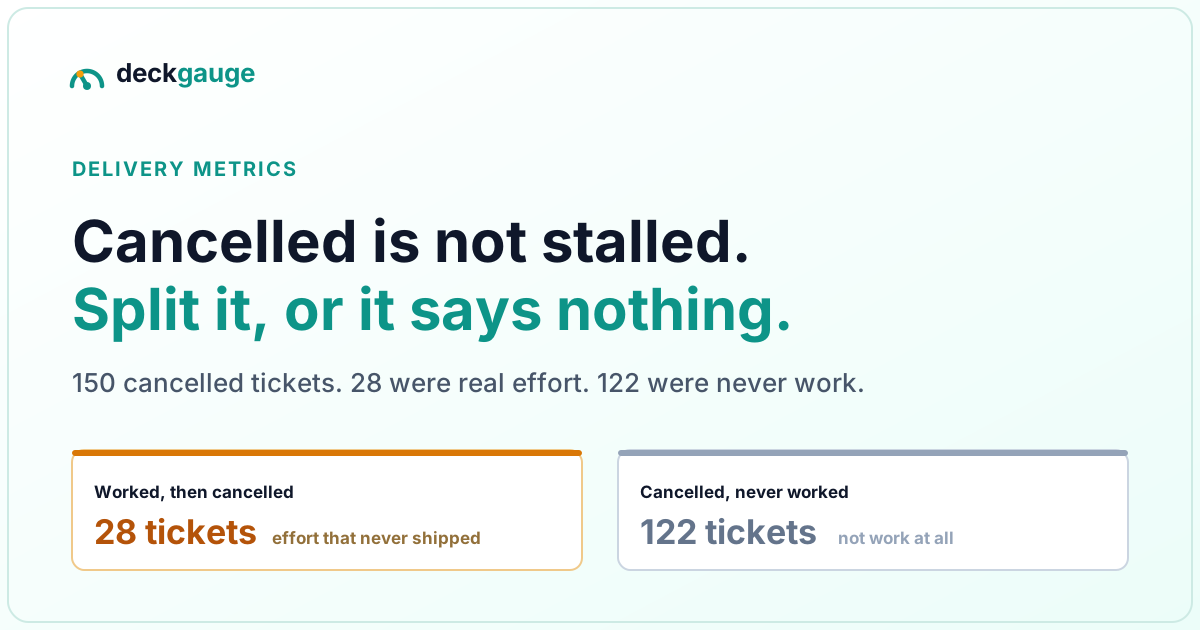
- Most dashboards drop cancelled tickets into "not started". On one measured board that was 150 tickets filling 46% of the backlog bar — a bar people were reading as a planning problem.
- Cancelled work is abandoned, not stalled. It deserves its own stage.
- The split that makes it meaningful: 28 tickets had been worked, 122 never were. Only the first kind is effort.
- Most of the effort behind a cancellation predates the window you are looking at. Counting only in-window days can understate it by an order of magnitude.
- Do not turn it into a team scorecard. Cancellation is almost always a decision taken above the people who did the work.
What happens to a cancelled ticket in your dashboard right now?
Almost certainly one of two things, and both are wrong in a way that is hard to see.
Either it is excluded — filtered out as "not real work", along with the three weeks somebody spent on it — or it is swept into the not-started bucket, where it sits next to tickets nobody has picked up and quietly makes your backlog look worse than it is.
Here is what that looked like on a real board with 832 tasks in a 90-day window:
| Tickets | Where they were being counted | |
|---|---|---|
| Cancelled, total | 150 | "Not started / stalled" — 46% of that bar |
| of which: worked, then cancelled | 28 | Real effort, invisible |
| of which: cancelled, never worked | 122 | Not work at all, inflating a backlog figure |
Two different findings had been superimposed and cancelled each other out. Anyone reading that bar concluded the team had a large backlog. The actual findings were that most of the backlog had already been decided against, and that twenty-eight tickets of real work never reached production and nothing on the page said so.
Why does the before-and-after split matter so much?
Because they are not the same event and they do not have the same cause.
A ticket cancelled before anyone touched it is a planning artefact. Somebody wrote it down, priorities moved, it was closed. That is a system working correctly, and counting it anywhere as work misdescribes the window. It should leave the population entirely — and the report should say how many left, so the numbers still reconcile.
A ticket cancelled after somebody started it is different in kind. Effort was spent. It produced nothing that reached a customer. And unlike almost every other signal a tracker holds, it points at a specific, fixable place in the process: a commitment was made before it was understood well enough to hold.
The framing that keeps this useful. Deckgauge's funnel calls this band "Aborted work". It briefly read "Wasted effort", which was accurate and unusable: the team did the work that was asked of them, and calling their output waste blames them for a decision taken above them. Same finding, less verdict — and the name determines whether anyone will look at it twice.
How do you measure it?
Four steps, all of which run on transition history you already have.
- Decide which statuses mean "abandoned." On Jira this is usually
Cancelled; on Azure DevOps it isRemoved. This is a mapping decision, not a global truth — some teams useWon't Do, some close toDonewith a resolution, and a tool that hard-codes one vocabulary will be wrong for most people. - Ask whether each one ever entered a working state. This is the whole trick, and it is a question the transition history answers directly. Never-worked tickets leave the population.
- Sum the days the survivors spent in a working state. Calendar days in progress, not estimates.
- Decide, explicitly, whether to count in-window days or all-time days — and say which. See below, because this is where the number swings the most.
The window problem, and why the honest answer is "say which"
A cancellation is a recent event. The effort behind it usually is not. So a report windowed to the last quarter sees the cancellation but only a sliver of the work that led to it.
Measured on that same board, with ad-hoc SQL run specifically to size the decision:
| Basis | Tickets | Days |
|---|---|---|
| In-window attention only | 12 | 22.4 |
| All-time attention on tickets cancelled in-window | 28 | 268.5 |
Roughly a twelvefold difference. Both are defensible answers to slightly different questions — how much effort did this quarter lose versus how much accumulated effort did this quarter's cancellations write off — and the failure mode is not picking the wrong one, it is picking one silently.
Those two figures are estimates used to make a design decision, not product output. They came from a hand-written window function over the transitions table and they include parked time. Quoted here because the ratio is the point; do not treat 268.5 as a number any tool will reproduce.
The rollup trap: one cancelled epic is not twelve cancelled tickets
If your hierarchy has epics, stories and sub-tasks, and your funnel counts all three as peers, a cancelled epic with eleven cancelled children scores twelve points. The bar swells and nothing new has happened.
Roll work up to the top-level item it hangs under before you count stages. On the board where this was measured, 828 issues rolled up to 85 features and the aborted-work band went from 28 issues (4%) to 9 features (11%) — a smaller absolute number and a much larger share, which is the correct shape.
One subtlety worth stealing if you build this yourself: a feature should only read as aborted when every child was cancelled. Rank it any higher and a feature with one cut sub-task and one live one reads as wholly abandoned and drops off the page while still holding real scope. The inverse also bites — a feature is only "in production" when nothing beneath it is still unstarted, or a single completed sub-task will report the whole thing as delivered.
Turning it on where it has never been on
The scale of what is currently invisible is worth stating plainly. Across one Azure DevOps
install, the Removed state held:
| Bucket | Work items |
|---|---|
Total Removed | 3,007 |
| Worked, then removed | 783 |
| Removed, never worked | 2,224 |
Seven hundred and eighty-three work items that consumed real engineering days and produced nothing shippable — and 2,224 that were never work and had been quietly padding every denominator they touched.
What to actually do with the number
Three readings, in descending order of usefulness:
| Pattern | Likely cause | Where to look |
|---|---|---|
| Cancellations happen within days of starting | Healthy. The system caught it early | Nothing. This is what you want |
| Cancellations happen after weeks in progress | Commitment made before the work was understood | Refinement and intake, not execution |
| Cancellations cluster on one epic or programme | A strategy change nobody unwound in the tracker | Planning. Close the rest deliberately rather than letting it rot |
| The rate is rising quarter on quarter | Priorities changing faster than a cycle can absorb | Commitment horizon — you may be planning further ahead than you can hold |
What not to do: make it a team target. The moment aborted work is something a team is measured on, the incentive is to stop cancelling things — to let dead work limp along to Done rather than admit it. That is strictly worse than the problem you were trying to solve, and you will not be able to see it happening in the same dashboard.
Seeing it in Deckgauge
Aborted work is one of the five bands in the Team Focus delivery funnel, and the never-worked exclusion is automatic — the caveats block states how many tickets left the population and why. Which statuses mean "abandoned" is a per-board stage map you edit from the widget itself, listing only the statuses your own sources actually report.
Deckgauge is free, source-available and self-hosted. The live demo has the funnel seeded if you would rather look before installing.
Frequently asked
- Should cancelled tickets be counted as stalled work?
- No. Cancelled work is abandoned, not stalled, and merging them hides both. On one 90-day window, 150 cancelled tickets were filling 46% of the "not started" bar — a bar people were reading as a backlog problem when most of it was work that had already been decided against.
- What is the difference between work cancelled before and after it started?
- Everything. A ticket cancelled before anyone touched it is not work at all — it is a planning artefact, and counting it inflates every denominator it lands in. A ticket somebody started and that was then cancelled represents real effort that never reached production, and that is the process signal worth tracking. On the measured board the split was 28 worked against 122 never worked.
- How do I measure effort spent on cancelled work?
- Take the tickets that were cancelled in the window, keep only those that ever entered a working state, and sum the calendar days they spent in one. The important design decision is whether to count only days inside the window or the whole life of the ticket — most of the effort behind a cancellation usually predates the window, and only the cancellation is recent.
- Is a high cancellation rate a sign of a bad team?
- Usually the opposite. Cancellation is nearly always a decision taken above the team — a priority change, a customer who went away, a strategy that moved. The team did the work asked of it. Treating the number as a team performance metric is the fastest way to make people stop cancelling things that should be cancelled.
- What should I actually do about aborted work?
- Look at when in the lifecycle the cancellations happen. Work cancelled within days of starting is cheap and healthy — the system caught it. Work cancelled after weeks in progress points at a commitment made before it was understood, which is a refinement or intake problem rather than an execution one.
For the wider question this sits inside — what a whole quarter of engineering attention went into — see where did the engineering quarter actually go?. And if your delivery numbers look implausible in the other direction, your WIP number may be 47× too high.