Engineering analytics
Why your work-in-progress number is 47× too high
The short version.
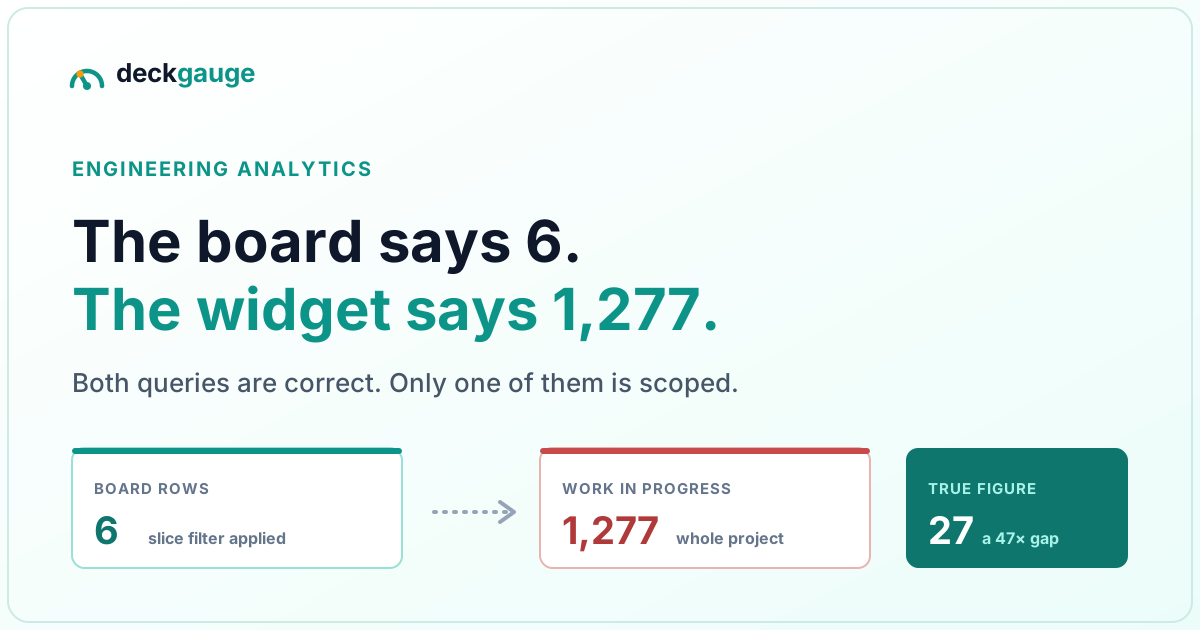
- A small team's board showed 6 rows. Its Work in Progress widget showed 1,277.
- The widget was not broken. It was correctly answering a query scoped to the whole project.
- A board has two scopes — which system to connect to, and which slice of it this board is about — and analytics pipelines routinely carry only the first.
- The tell: two boards with nearly disjoint scopes reporting almost the same number.
- Azure DevOps has a second trap on top: repositories cannot scope work items, and picking them looks like it should work.
The report that started it
A board owner opened a compliance team's board. Small team, focused scope. The board itself listed six rows. The Work in Progress widget above it read 1,277.
Their reaction was the right one, and sharper than most: a small team should not have that much in flight, so perhaps the board's filters were not reaching the widget. That guess was exactly right, and it is worth dwelling on how unobvious it is. Nothing about the widget looked broken. It rendered, it had a plausible-looking number, and re-running its own SQL by hand reproduced 1,277 precisely. The query was correct. Its scope was not.
A board is configured with two things, and only one of them travelled
Every board that syncs from a tracker carries two distinct settings, and it is easy to collapse them into one:
- Which system to connect to — this Jira project, this Azure DevOps project, this repository.
- Which slice of it this board is about — a JQL filter, a component, an area path, a label.
The board grid honours both. It has to: if it did not, the board would be unusable. The analytics path received only the first, so every issue-derived widget reported on the entire project. Not one widget — every one: work in progress, ticket coverage, lead time, backlog age, completion trend, flow, investment allocation, period-over-period, and the SQL console behind them.
Here is the decomposition, reproduced by executing the widget's own SQL:
| Leg | WIP counted | Scope actually applied |
|---|---|---|
| Jira | 909 | All of project PLAT |
| Azure DevOps | 368 | All of project Atlas |
| Total | 1,277 | Matches the screenshot exactly |
And what the configured filters would have produced:
| Scope | Items | WIP |
|---|---|---|
Jira, project PLAT | 2,504 | 930 * |
Jira, PLAT + the board's component filter | 49 | 23 |
ADO, project Atlas | 20,618 | 368 |
ADO, Atlas area path Atlas\Compliance | 113 | 4 |
* The unfiltered Jira leg reads 909 in the first table and 930 in the second because they are two separate measurements of the same scope, taken a day apart — the widget's own query, and a standalone count. The difference is ordinary churn on an active project and changes nothing here.
The honest headline is 27, against 1,277 displayed. A 47× over-count, on a widget that had never once thrown an error.
This is not rare, and the exposure is easy to measure. On that install, 9 of 13 Jira board sources carried a JQL filter — all nine affected. All 25 Azure DevOps sources had their work items scoped project-wide. If you run a tool that connects to trackers, this is worth checking today rather than assuming.
How to tell whether it is happening to you
Three checks, in increasing order of effort.
1. Compare the widget to the board
Crude and effective. If your board lists tens of rows and a work-in-progress widget above it reads in the hundreds or thousands, they are not describing the same thing. They should be in the same order of magnitude.
2. Put two differently-scoped boards side by side
This is the diagnostic that actually proves it, and it is the one the board owner reached for. Three boards from the same install:
| Board | Jira (narrowed) | ADO (project-wide) | Total |
|---|---|---|---|
| Platform | 21 | 373 | 394 |
| Compliance | 23 | 368 | 391 |
| Payments | 50 | 23 | 73 |
The first two boards have near-disjoint Jira scopes — 86 issue keys and 49, with one in common — and they land three apart. That is not a coincidence to be explained; it is the signature. One unfiltered Azure DevOps project accounts for 373 of the first total and 368 of the second, and whatever narrowing does exist is swamped by the dimension that has none.
Generalise it: if two boards you know to be about different work report almost the same number, the number is not about the boards.
3. Decompose by source
Ask what each connected system contributes. A total dominated by the one leg you never filtered is the answer.
The Azure DevOps trap: repositories cannot scope work items
This one deserves its own section, because it is the most confidently-made mistake in the whole area and the product surface actively invites it.
You attach an Azure DevOps project. You see a repository picker. You select the two repositories your team owns. You reasonably conclude the board is now scoped.
It is not, and it cannot be. Work items in Azure DevOps have no repository association at all — the work-items table has no repository column, because a work item is not owned by a repository. So a repository selection narrows pull requests, commits and deployments, and narrows work items by exactly nothing.
The two dimensions, and what each one actually governs:
| Dimension | Scopes | Does not scope |
|---|---|---|
| Area path | Work items — board rows and every issue-derived metric | Pull requests, commits, deployments |
| Repository | Pull requests, commits, deployments | Work items, at all, by any amount |
The fix on the product side is not a bigger warning, it is a label that says what the control does: "Scopes pull requests, commits and deployments. Work items are scoped by area path." If you are choosing a tool, this is a good thing to check — a repository picker with no mention of area paths anywhere near it is a tool that has not thought about this.
And repositories matter enormously on the code side
Because the same install had the mirror-image problem. One project held 21 repositories and 2,513 pull requests. In one widget's window, 58 pull requests were in the board's intended scope and 275 were not — and the two groups had median cycle times of 0.6 hours and 5.8 hours respectively.
The displayed median was not merely noisy. It was dominated by repositories the team had nothing to do with, differing by roughly 10×. A team optimising against that figure would have been chasing another team's build pipeline.
Narrowing what you sync does not retract what you already synced. If you reduce a project's repository list, rows already written by earlier syncs stay where they are — nothing deletes them. Ingest scope and query scope are different controls, and only the second one fixes a polluted widget. This is why a per-board query-time filter is the thing that matters.
One more: don't let one checkbox gate two things
A related trap, found while fixing the first. An Azure DevOps source supplies both code and work items. If a single "include this source in analytics" flag gates both, then someone unticking it because they do not want PR metrics silently removes several hundred work items from every issue-derived widget on the board.
Nobody makes that connection when the numbers move. The flag should gate code; the work-item scope should be the area path.
What to do about it
| Step | Why |
|---|---|
| Check every board source has a slice filter, not just a connection | A JQL filter, a component, an area path. An empty slice means project-wide |
| Set area paths on every Azure DevOps source | It is the only work-item scope that exists |
| Set a per-board repository scope for code metrics | Query-time, so it fixes history already ingested |
| Re-baseline after the numbers move | Your trend lines have a discontinuity in them now, and it is a correction rather than a regression |
| Tell the team the old numbers were wrong | Someone made a decision on 1,277. They deserve to know |
That last row is not a courtesy. The reason this class of defect is expensive is not the wrong number — it is that the wrong number was plausible, so it was believed, and things were decided on it.
How Deckgauge handles it
Board source filters reach the analytics path: a Jira source's JQL filter is resolved to a set of issue keys at sync time and widgets filter on it, and Azure DevOps area paths scope work items by prefix. Repository scope is a per-board, query-time filter over pull requests, commits and deployments. Which filters apply where is documented explicitly in Filters and date ranges, including the one that deliberately does not.
Deckgauge is free, source-available and self-hosted, so your delivery data stays on your own infrastructure. The live demo is seeded if you want to look first.
Frequently asked
- Why does my engineering dashboard show far more work in progress than my board?
- Almost always because the dashboard is scoped to the connection rather than to the slice. A board is configured with two things — which system to connect to, and which part of it this board is about — and many tools carry only the first through to analytics. The widget then reports correctly on the entire project while the board shows the filtered subset.
- Can I scope Azure DevOps work items by repository?
- No, and this is the most common misconfiguration in ADO analytics. Work items have no repository association at all — the table has no repository column — so a repository selection cannot narrow them by any amount. Repositories scope code: pull requests, commits and deployments. Area paths are the work-item scope.
- How do I tell whether a dashboard number is wrong or just surprising?
- Decompose it by source. If a board draws on Jira and Azure DevOps, ask what each leg contributes. A number dominated by one leg, where that leg happens to be the unfiltered one, is a scope problem rather than a delivery problem. Two boards with nearly disjoint scopes landing within a few points of each other is the same tell.
- My numbers dropped sharply after an upgrade. Did I lose data?
- If the drop coincides with source filters starting to be applied to analytics, the new number is the correct one and the old one was counting the whole project. The way to confirm it is to compare the widget against the board’s own row count — they should now be in the same order of magnitude.
- Does turning off "include code in analytics" also hide work items?
- It should not, and a tool where it does has conflated two things. An Azure DevOps source supplies both code and work items; gating both behind one checkbox means unticking a code preference silently removes hundreds of work items from every issue-derived widget. In Deckgauge that flag gates code only.
Once the numbers are scoped correctly, the interesting questions start: where did the engineering quarter actually go? and what happened to the work that was cancelled?