Engineering leadership
Where did the engineering quarter actually go?
The short version.
- Nobody asks "how fast is our cycle time" at a board meeting. They ask what did a quarter of engineering buy us, and flow metrics cannot answer it.
- You do not need timesheets. Your tracker already records when every ticket entered and left every status.
- Turn that into attention days, classify each task as roadmap, operational or internal technical, and divide. That is the whole method.
- Expect the first number to be uncomfortable and expect it to be disputed. Both are fine if every classification is printed with its reason.
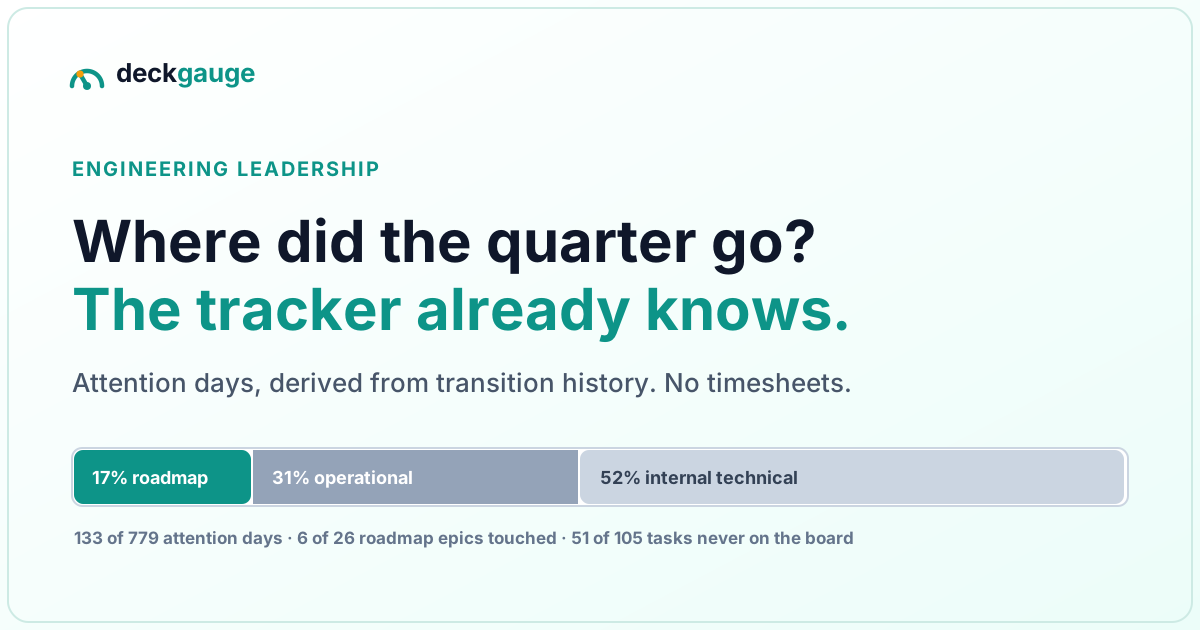
- On one real team: 17% of attention on the roadmap, 6 of 26 roadmap epics touched, and 51 of 105 tasks that never appeared on any board at all.
Why can't flow metrics answer this?
Every engineering-metrics product on the market is very good at one family of questions. How long does a change take to merge? How long does a review sit? How often do we deploy? These are real questions and they are worth measuring — Deckgauge measures them too.
But they all share a denominator: the ticket. And a ticket-denominated metric cannot distinguish a quarter that moved the roadmap from a quarter that did not, because both quarters can have identical cycle time, identical throughput and identical review latency. A team that closes ninety small operational tickets looks, on a flow dashboard, exactly like a team that shipped the thing it was funded to ship.
The question leadership actually asks has a different denominator. It is not how efficiently did we work, it is what did the work go into. Those are orthogonal, and one dashboard answering the first is routinely mistaken for an answer to the second.
How do you measure where the time went without timesheets?
The uncomfortable truth about time tracking in engineering is that the accurate version is unaffordable and the affordable version is inaccurate. Ask people to log hours and you get a number shaped by how tired they were on Friday afternoon.
So do not collect it. Derive it. Jira and Azure DevOps both write a transition record every time a ticket changes status — when it entered In Progress, when it left Code Review, to the second. That history is complete, it is free, and nobody has to remember to produce it.
Sum the calendar days each task spent in a working state, clipped to the window you care about. Call the result attention days. It answers proportion questions precisely and answers duration questions not at all — which is exactly the trade you want, because the question is a proportion question.
Attention days are not hours, and the distinction is load-bearing. Tasks overlap. In the reference window one engineer held eleven tasks in a working state simultaneously, so his attention days summed across tasks far exceeded the number of days in the window. Anyone who presents this figure as person-hours or as capacity is misreading it — which is why the label belongs on the face of the chart rather than in a footnote.
The one thing that will trip you up: parked work
A ticket accrues attention days whether or not anyone touched it. A ticket that entered In Progress in March and is still sitting there in June has ninety-odd attention days behind it and possibly no work at all.
So split the two. Count the headline share using only tasks that actually moved in the window, and report parked days separately rather than folding them in. On the reference window that is the difference between a 17 / 31 / 52 split across the three classes and a 20 / 37 / 44 one — and almost the entire gap is three of the team lead's tickets sitting 89 days in a working state without moving once.
Fold parked days in silently and you report a team that spent a third of its attention on something nobody worked on. Drop them entirely and you hide the most actionable finding on the page.
Classifying the work: three buckets, and who decides
Attention days tell you how much. Classification tells you into what. Three buckets are enough, and a fourth is a trap:
| Class | What belongs in it | Why it is not a judgement on anyone |
|---|---|---|
| Roadmap / CapEx | Work that delivers a roadmap item or a tracked programme | The thing the quarter was funded for |
| Operational / OpEx | Customer-visible defects, performance problems, one-off requests | Necessary. Keeps the platform standing without advancing it |
| Internal technical | Refactors, tooling, CI, test debt, dependency work | Often the highest-leverage work on the list, and almost always invisible to leadership |
Use the vocabulary your organisation already maintains. If finance audits a CapEx/OpEx field on your tickets, that field is both free and authoritative — and once it feeds a number a VP reads weekly, it acquires a reason to be maintained that a quarterly capitalisation exercise never gave it.
Measured, and it is the reason this matters. Across one real install of 36,932 board rows, exactly 111 carried any cost classification at all — 0.3%, concentrated almost entirely on a single board. The field existed. It fed one export nobody read. Nobody maintained it, and nobody was wrong not to.
Classify by inheritance, not by ticket
Nobody is going to classify four hundred tickets. They will classify the twenty-seven epics, and they will do it once. So walk each task's parent chain and take the classification from the nearest ancestor that has one.
The difference is not marginal. On the board where this was measured, 27 classified epics covered 482 tasks while only 19 were being matched — because only the epics themselves carried the flag and nothing propagated it downward.
Whatever inheritance cannot reach, a small ordered rule set can take a bite out of, and a language model can propose a class for the remainder. Two rules about the model, both learned the hard way:
- It must never run on page load. Classification is a thing you do deliberately, not a cost you incur by opening a tab. Cache the verdicts against the task's content so unchanged work is never re-classified.
- It must not be allowed to invent a roadmap link. Models return plausible-looking epic keys that do not exist. Accept one and you have credited an epic nobody worked on — deleting the exact number the report exists to produce.
What the honest version looks like when you run it
Here is one real team — five people, three months, and a report that was built by hand before any of it was automated:
| Finding | Figure | What it prompted |
|---|---|---|
| Attention on roadmap work | 17% (133 of 779 days) | Not a failing grade. A conversation about what the other 83% was |
| Roadmap epics touched | 6 of 26 | Were the other twenty deferred deliberately, or did nobody notice? |
| Tasks that never moved | 31 of 105 | A planning conversation, not a performance one |
| Tasks that never reached the board | 51 of 105 | The board did not describe what the team does |
| Tasks found by counting one tracker | 47, against 105 counting both | A team mid-migration reports half its own work |
The fourth row is the one that reframed everything. Half the work the team did had never appeared on any board. It existed only in Azure DevOps. Any report built from board rows would have inherited exactly that blind spot and reported confidently on the half it could see.
Which produces the first design rule for anyone building this: the board defines who and what scope; the tracker history defines the task set. If your reporting reads the rows on a board, you are measuring your reporting process, not your engineering.
The parts that stop it becoming a stick
A report about where people's attention went is one careless design decision away from being a performance review nobody consented to. Four safeguards, all structural rather than cultural — because a norm holds until the first tense quarter:
| Failure mode | The structural fix |
|---|---|
| A mid-quarter joiner reads as idle | Find each person's first recorded activity. If it lands inside the window, compute every rate from that date. On the reference window this took one engineer from an apparent 38% active days to a true 75% — same person, same 21 days of work |
| An expired token reads as a team that did nothing | Assert identity before the pull. An expired Jira token does not error on search — it silently downgrades to anonymous and returns an empty result. Report zero as a source failure, never as an idle team |
| A manager's row looks weak | Print, on the table itself, that ticket counts exclude reviewing, mentoring, incident response and meetings. In the reference window the lead showed 16 tasks and 0 in production while opening more pull requests and casting more reviews than anyone he managed |
| A classification is wrong and unarguable | Print the one-line reason on every row and let anyone with edit rights override it. A number nobody can inspect is the one that gets weaponised |
There is a fifth, quieter one: generate the caveats rather than writing them. A fixed block of disclaimers gets skimmed after the second read and stops being information. A block where every line corresponds to something that happened to this window — this migration correction, this identity merge, this late joiner — keeps its weight, because it changes.
What to do with the number once you have it
Not benchmark it. There is no credible industry figure for roadmap share, and every one in circulation traces back to a survey using a definition that is not yours. The comparisons worth making are two:
- Against what leadership believed. The gap between the assumed number and the measured one is the finding. If everyone expected 60% and it is 17%, the roadmap was never funded — it was hoped for.
- Against your own last quarter. Direction beats level. A team moving from 17% to 30% is doing something right regardless of where the number "should" be.
And when the number is low, resist the reflex to fix it by pushing operational work down. Most of the time the honest reading is that the roadmap was under-resourced from the start, and the team absorbed the difference quietly for three months. That is worth knowing before you plan the next three.
Doing this in Deckgauge
All of the above is the Team Focus view — a board tab that reads the Jira and Azure DevOps history you already sync and needs no configuration to be useful on first open. It ships as an applyable preset with twelve widgets: the roadmap share, the delivery funnel, a person-by-person attention split, a coverage map, and a ledger where every classification prints its own reason.
Deckgauge is free, source-available and self-hosted, so the delivery data never leaves your infrastructure. If you would rather see it working before installing anything, the live demo has the whole thing seeded.
Frequently asked
- How can I find out where my engineering time actually went?
- Derive it from the transition history your tracker already writes, rather than collecting it. Every ticket records when it entered and left each status, so the calendar days it spent in a working state are already known. Group those days by what the work was — roadmap, operational, internal technical — and you have a share-of-attention breakdown that nobody had to fill in and nobody can forget to fill in.
- What is a good ratio of roadmap work to maintenance?
- There is no credible benchmark, and anyone quoting one is quoting a survey whose definitions are not yours. The useful comparison is against your own previous quarter and against what leadership believed was happening. A team that discovers it spent 17% of its attention on the roadmap has learned something whether the "right" number is 40% or 70%.
- Why not just ask engineers how they spent their time?
- Because recall is poor over a quarter, because the answer is shaped by who is asking, and because it does not scale to a quarterly cadence. More practically: the data already exists. A survey asks people to reconstruct something the tracker recorded at the time.
- Does measuring this turn into surveillance of individual engineers?
- It does if you build it carelessly. The safeguards that matter are structural: report share of attention rather than hours, compute every rate for a mid-quarter joiner against their own start date, state plainly that ticket counts exclude reviewing and mentoring, and print the reason behind every classification so anyone can contest it. A number nobody can inspect is the one that gets weaponised.
- What does "attention days" mean, and is it the same as effort?
- No. An attention day is a calendar day a task spent in a working state. Tasks overlap — one engineer in the reference window held eleven in a working state at once — so days summed across a person’s tasks can exceed the days in the window. It is a denominator for proportion questions, not a measure of hours worked.
Two companion pieces go deeper on the parts this one compresses: cancelled tickets are a process metric, not a mess covers the effort that never reaches production, and why your WIP number is 47× too high covers what happens when a dashboard is scoped to the wrong slice of a project.