Planning accuracy
Say-do ratio in Jira: gadgets, JQL workarounds, and what actually works
The short version.
- Jira has no native say-do ratio gadget. Nothing in the standard gadget list computes the percentage or charts it across sprints.
- The Sprint Report holds the raw ingredients for one sprint — committed vs completed issues — but no ratio and no trend.
- A JQL filter gadget gets you two counts and manual division; it breaks on mid-sprint scope changes and never builds history.
- A real say-do chart needs the commitment snapshot at sprint start, done-family statuses, and one bar per closed sprint against a target — that data is in Jira, the chart just doesn't live there.
- There is no Deckgauge Jira gadget either — Deckgauge reads Jira read-only and draws the trend itself.
You have the metric — the say-do ratio: the percentage of issues committed at sprint start that actually reached Done by sprint end, healthy at 80–90% sustained. Now you want it where the team already looks: a tile on the Jira dashboard. This is the honest inventory of what gets you there and what doesn't.
What Jira gives you natively
Search the "Add gadget" dialog for commitment, accuracy or say-do and nothing matches. The native pieces that come close, and what each one actually is:
| Jira piece | What it shows | Why it isn't say-do |
|---|---|---|
| Sprint Report | Committed vs completed issues for one sprint | The raw ingredients, per sprint, by hand. No percentage, no trend. |
| Sprint Health gadget | Scope and status of the current sprint | Scores a sprint in flight; say-do only means something on closed sprints. |
| Velocity chart | Story points committed vs completed per sprint | Closest native cousin — but in points, for estimation, and it says nothing about issue-level commitment reliability. |
| Created vs Resolved chart | Gross issue flow over time | Counts everything ever opened; commitment never enters it. |
None of these compute the ratio. That's not Jira being lazy — the say-do ratio needs a snapshot of what was committed at sprint start, and a dashboard gadget culture built on live filters doesn't keep snapshots.
The JQL workaround, and where it breaks
The usual hack: two saved filters and two Filter Results gadgets side by side.
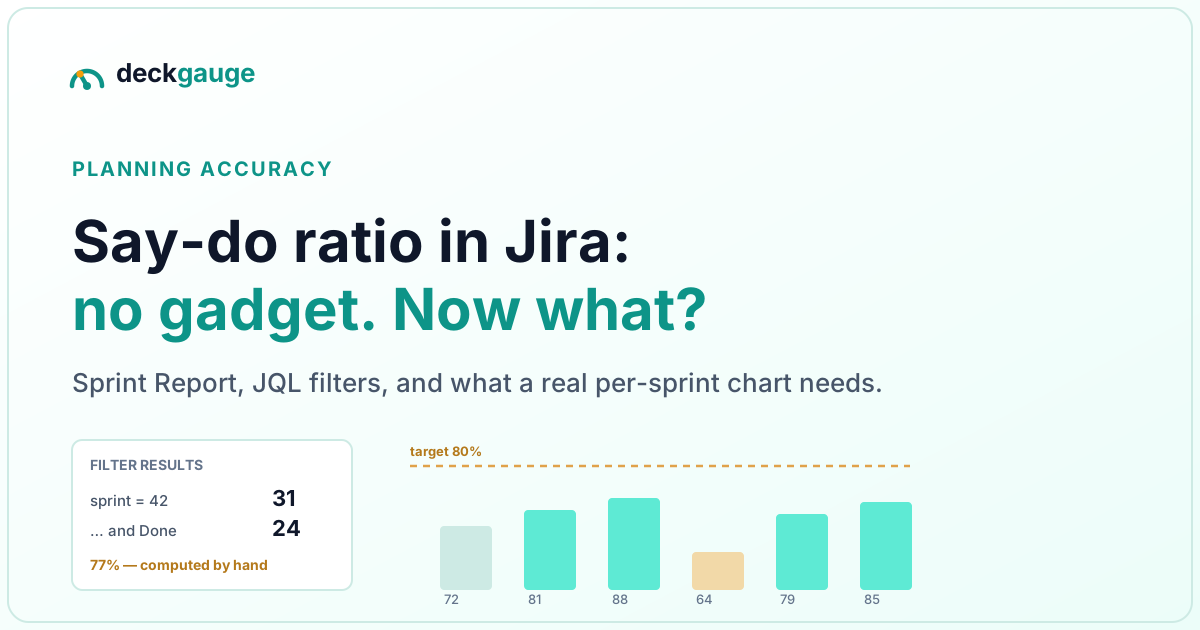
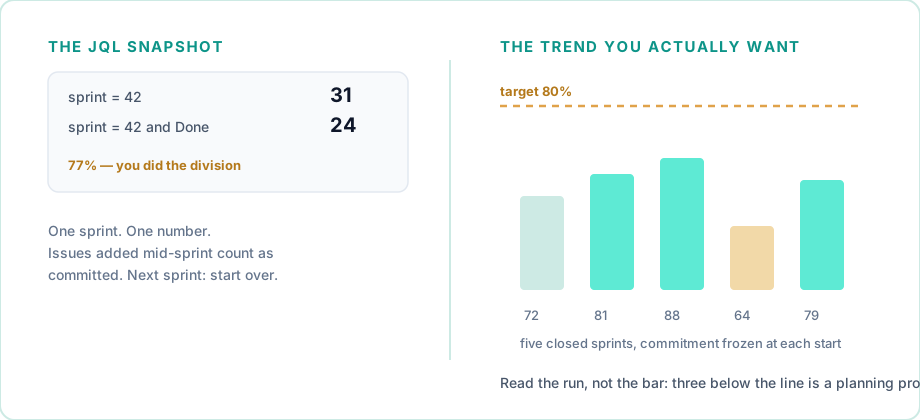
sprint = 42 — everything in the sprint.
sprint = 42 and status in (Done, Closed, Resolved) — the finished slice.
Divide the second count by the first and you have something that looks like a say-do ratio. Three things are quietly wrong with it:
- Mid-sprint additions pollute the denominator. "Committed at sprint start" is not a JQL concept. An issue added on day 8 of a 10-day sprint counts as commitment, which is exactly the mistake the metric exists to prevent.
- Done statuses vary per workflow. Done, Closed, Resolved is the common family, but workflows carry custom terminal statuses. Guess wrong and every sprint under- or over-counts.
- It's a snapshot, not a history. You get one sprint's number, manually, today. The say-do ratio is a trend instrument — six bars tell you something, one bar answers nothing — and filters don't accumulate bars.
What a proper say-do chart needs
Four things, all derivable from Jira, none of them gadget-shaped:
- The commitment list frozen at sprint start — not the sprint\u2019s final membership.
- A done-family status mapping that matches your workflow\u2019s terminal statuses.
- One bar per closed sprint, so the metric accumulates into a trend.
- A target line to read against — 80% is the common choice, matching the 80–90% healthy range.
This is how Deckgauge's Iteration Planning Accuracy widget works. The Jira connection is read-only — it pulls issues, the full status-change history, and sprint fields, and never writes anything back — and the widget draws one bar per closed sprint against a fixed 80% target line, reading 8 iterations back by default (configurable to 4 or 12). The same widget lights up for Azure DevOps iterations; it stays dark for GitHub and GitLab sources, because issues there have no sprint boundary to define "committed at the start".
If it must live on the Jira dashboard
Honest answer: your options are a marketplace app that adds the gadget, or accepting a link-out. Deckgauge is deliberately the second kind — there is no Deckgauge Jira gadget, and the chart lives in Deckgauge, fed by the read-only Jira sync. If a tile inside Jira itself is the requirement, the Atlassian Marketplace is the place to look; just check any candidate against the four requirements above, because most dashboard apps trend live filters and will hand you the mid-sprint-additions problem right back.
Frequently asked
- Does Jira have a say-do ratio gadget?
- No. Jira ships no gadget that computes the say-do ratio or charts it across sprints. The closest native piece is the Sprint Report, which lists committed and completed issues for a single sprint — the raw ingredients, not the percentage, and no trend. Teams that want the ratio on a dashboard either approximate it with JQL filter gadgets or pull it from a tool that reads sprint history.
- Can you calculate the say-do ratio with JQL?
- Partially, and only as a snapshot. A filter like "sprint = 42 and status in (Done, Closed, Resolved)" next to a filter for everything in sprint 42 gives you two counts; you do the division by hand. Two things break it: issues added mid-sprint count as committed ("committed at sprint start" is not a JQL concept), and your workflow’s done statuses may not match the ones you guessed. It answers one sprint, once — it does not build the trend, which is the whole point of the metric.
- What is a good say-do ratio?
- Between 80% and 90%, sustained. High enough that stakeholders can plan around the team’s commitments, low enough that the team isn’t sandbagging. A team that sits at ~100% sprint after sprint is committing to less than it can do — a capacity-planning finding, not a trophy.
- Does Deckgauge embed in Jira?
- No. There is no Deckgauge Jira gadget or marketplace app. Deckgauge connects to Jira read-only — it pulls issues, full status history, and sprint fields, and never writes back — and the say-do chart (one bar per closed sprint against an 80% target line) lives in Deckgauge itself.
- Say-do ratio vs. Jira Sprint Report — what’s the difference?
- The Sprint Report is the source data for one sprint: which issues were committed, which completed. The say-do ratio is that comparison turned into a percentage and repeated for every closed sprint, so you can see the trend. The report answers "what happened in sprint 42"; the ratio answers "can this team’s dates be trusted".
This is the tooling side of the metric. The metric itself — calculation, charting, the 80–90% range, and how to read it without turning it into surveillance — is covered in the say-do ratio guide; the adjacent Jira question is why not just use Jira for engineering metrics altogether.