Jira
Can you get DORA metrics from Jira? An honest accounting
The short version.
- No, not from Jira alone. Jira is a work tracker; by default it records no deployment reaching production.
- Two of the four are conditionally reachable: time to restore if incidents are Jira tickets, deployment frequency if your CI pushes deploy events into Jira.
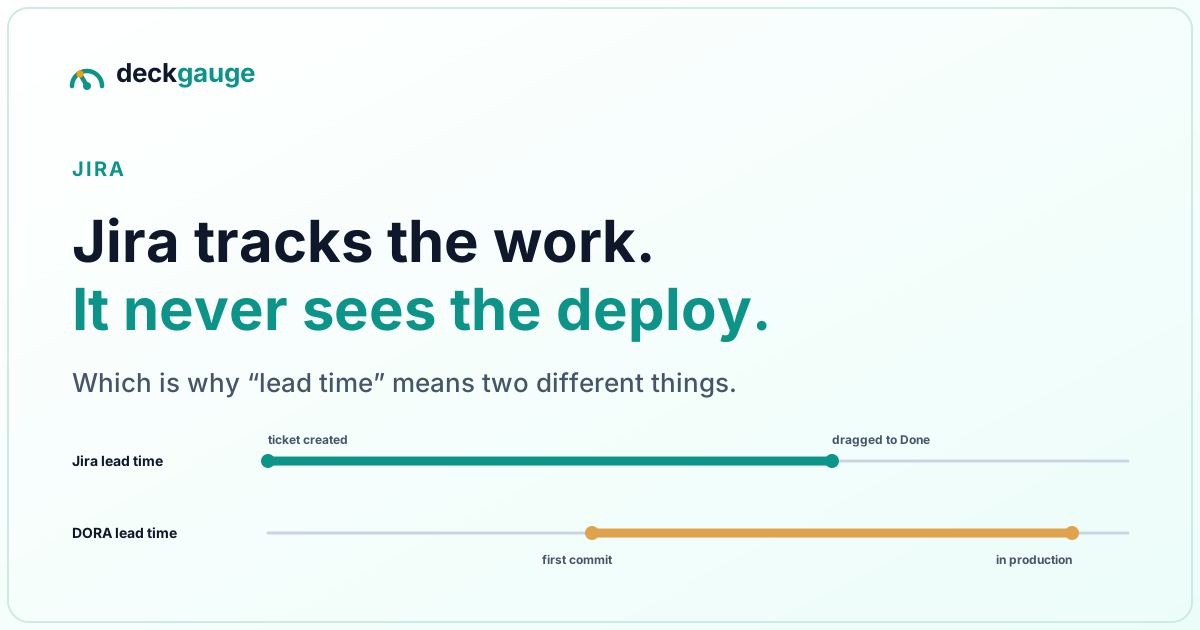
- Lead time is the trap. Jira lead time (created → done) and DORA lead time for changes (commit → production) are different measurements with the same name.
- What Jira is best at is the thing DORA does not measure: where work waits. That is usually where your delivery time actually goes.
- The fix is not a better Jira report. It is joining Jira to your Git provider.
Why can't Jira answer the DORA questions on its own?
Because three of the four DORA metrics are defined against an event Jira does not witness: a change reaching production. Deployment frequency counts those events. Lead time for changes measures the interval ending at one. Change failure rate is the share of them that cause a degradation. Jira knows that a human dragged a card to Done — which may have happened before the deploy, after it, or instead of it.
This is not a shortcoming of Jira. It is a category difference. Jira models intent and progress; DORA measures delivery. A tool that tracks the first exceptionally well is still guessing at the second.
| DORA metric | From Jira alone? | What it actually needs |
|---|---|---|
| Deployment frequency | Conditionally | Jira Cloud has a deployments surface, but it is populated by your CI/CD tool pushing deployment events in. No integration, no data |
| Lead time for changes | No | The first commit timestamp, from Git. Jira's created date is not the start of the change |
| Change failure rate | No | A deployment record plus a reliable link from incident to the deploy that caused it |
| Time to restore service | Yes, if | Incidents raised as Jira tickets, opened at detection and closed at resolution. This is the one DORA metric Jira is naturally good at |
The lead-time equivocation, and why it matters
This is the single most common error in this category, and it is worth stating precisely:
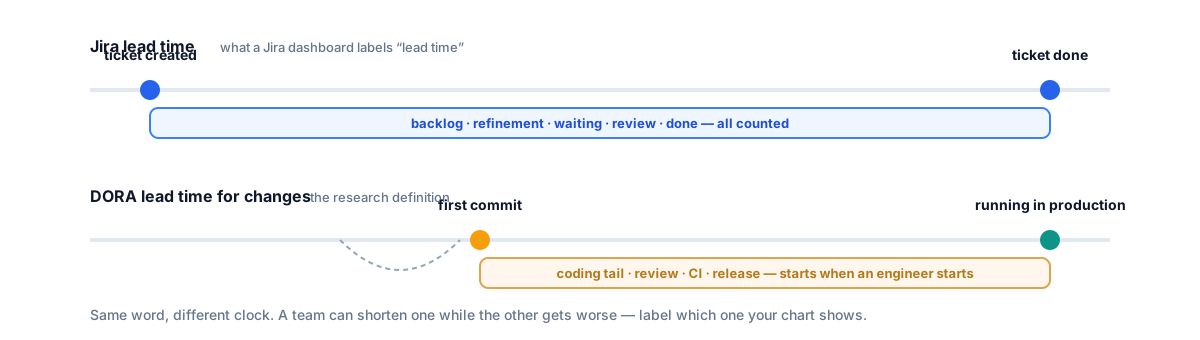
Jira lead time is normally ticket created → ticket done. It includes backlog time, refinement, prioritisation and every kind of waiting.
DORA lead time for changes is first commit → running in production. It begins when an engineer starts writing code and ends when users have it.
These overlap only partially, and they can move in opposite directions. Aggressively pruning a stale backlog shortens Jira lead time overnight without a single line of code shipping faster. Conversely, a team that commits early and often on long-lived branches can show excellent Jira lead time while changes sit unreleased for weeks. If a dashboard offers you "lead time" from Jira data, find out which one it means before you take it to a board meeting.
What is Jira genuinely the best source for?
Queue time — and this is the part most DORA-focused tooling underuses. Jira records every status transition with a timestamp, which makes it the highest-resolution record you have of where work waits:
- Time to first touch — how long a ticket sits after being committed to before anyone starts it.
- Time in code review — as tracked by your workflow states, which is often where the largest single block of elapsed time hides.
- Backwards transitions — how often work returns from review or QA to in-progress, a better quality signal than most quality metrics.
- Work in progress — how many things are open at once, which predicts cycle time more reliably than team size does.
- Status-level cycle time — the distribution, not the average. The tail is the story.
None of these are DORA metrics. All of them are actionable in a way "deployment frequency: 3.2 per week" is not, because each one points at a specific queue you can go and unblock. The four keys tell you whether you are fast; the transition data tells you where the time went.
How to measure what you can, step by step
If you start from a Jira project and nothing else, here is the honest sequence. It produces the two DORA metrics Jira can genuinely support, plus the flow data that is usually more actionable than the missing two.
- Fix the incident habit first. Decide that every incident becomes a Jira
ticket of a known type (e.g.
Bugwith an Incident label), opened at detection and closed at resolution. This single habit is what makes time to restore service computable later — without it, restore time is whatever your memory of last Tuesday says. - Turn on deployment recording in Jira, or accept you will not get frequency from Jira. Jira Cloud has a deployments surface, but it only fills if your CI/CD tool pushes deployment events in (Jira's own dev-tools integration, or one of the pipeline connectors). No integration, no data — and no JQL query can conjure it afterwards.
- Export or query the transition history. Jira records every status change
with a timestamp; the REST API exposes it as changelogs per issue (JQL plus the
expand=changelogparameter, or the search-jql endpoint in bulk). From that you get time in each state: time to first touch, time in review, backwards transitions. - Compute restore time from incidents. For each incident ticket: resolved date minus created date. Report the distribution, not the average — the tail is the story.
- Pull the other two metrics from Git. Lead time for changes starts at the first commit, and change failure rate needs deployment records linked to the incidents you started ticketing in step 1. Both live in your Git provider, not Jira.
- Label the lead time on every chart. Whatever you present, write which clock it measures — created → done, or commit → production. The two get compared across dashboards more often than anyone admits.
Done this way you get restore time and flow metrics from Jira alone, and a clean join point for the two delivery metrics that need Git. The alternative — a Marketplace app that promises all four from inside Jira — hits the same wall and usually resolves it by quietly redefining a metric.
So what should you actually do?
- Stop trying to derive DORA from Jira. Two of the four are structurally out of reach, and the versions you can fake will mislead you at exactly the moment you rely on them.
- Connect Jira to your Git provider. Jira supplies the work item and the queue time; GitHub, GitLab or Azure DevOps supplies commits, pull requests and deployments. Joined, the four keys become computable and you keep the flow detail.
- Take time to restore from Jira, deliberately. It is the one DORA metric Jira is well suited to — provided incidents are consistently ticketed with honest open and close timestamps.
- Report flow metrics alongside the four keys, not instead of them. DORA tells you the outcome; the transition data tells you the cause.
- Label your lead time. Whichever definition you use, put it on the chart.
How Deckgauge does it
Deckgauge is a source-available, self-hosted engineering intelligence platform, and this problem is close to the reason it exists — one board over Jira and your Git provider, rather than two dashboards that each know half the story. Concretely:
- Jira is read-only, always. Every call is a
GET. Deckgauge never opens, transitions, comments on or edits an issue, so connecting it cannot disturb your project's data. - Full transition history, not just current status. Deckgauge pulls each issue's complete status-change history, which is what makes cycle time, flow and in-progress-time analysis possible rather than approximate.
- Jira issues and Git activity on one board. Attach a Jira project and a GitHub, GitLab or Azure DevOps source to the same board and the four keys are computed across both, with the flow detail preserved.
- Status mapping is explicit and editable. Your workflow's states map onto board statuses through a UI rather than being inferred, because "which of your states counts as in progress" is a decision only you can make — and it silently changes every flow metric.
- Sprint fields are detected by shape. Jira's numeric custom-field id for Sprint differs between sites, so Deckgauge identifies it structurally instead of hardcoding an id that works on one instance and silently returns nothing on yours.
Free, source-available under the Functional Source License, no per-seat pricing, runs on your own infrastructure. The Jira connection guide covers tokens, project keys and the vanity-domain 401 that catches most first-time setups.
Frequently asked
- Can you get DORA metrics from Jira?
- Not all four, and not from Jira alone. Jira is a work tracker, not a delivery system: by default it holds no record of a deployment reaching production, which is the event two of the four DORA metrics are defined against. You can get time to restore service if you track incidents as Jira tickets, and you can get deployment frequency if your CI/CD tool pushes deployment events into Jira. True lead time for changes and change failure rate need Git and deployment data that lives outside Jira.
- What is the difference between Jira lead time and DORA lead time for changes?
- They measure different things and share a name. Jira lead time is normally ticket created to ticket done — it includes backlog time, refinement and waiting, and ends when someone drags a card. DORA lead time for changes is first commit to running in production. A team can improve Jira lead time by grooming the backlog more aggressively while DORA lead time gets worse. Never report one as the other.
- Which delivery metrics is Jira actually the best source for?
- Queue and flow metrics. Because Jira records every status transition with a timestamp, it can tell you how long work sits in each state — how long a ticket waits before anyone starts it, how long it sits in code review, how often it moves backwards. That is where most delivery time is actually lost, and it is something Git data alone cannot show you.
- Do I need a Jira Marketplace app for DORA metrics?
- A Marketplace app is one option, and it is the fastest to trial. The limitation is the same one Jira has: an app inside Jira can only see what Jira knows, so it faces the identical deployment-data gap and usually resolves it either by asking you to push deployment events in or by redefining a metric. A tool that reads both Jira and your Git provider does not have to make that compromise.
- Is Deckgauge able to write back to Jira?
- No. Deckgauge is a strictly read-only Jira client — every call it makes is a GET. It never opens, transitions, comments on or edits an issue. Board changes you make in Deckgauge stay in Deckgauge.
If your work items live in Azure DevOps instead, the companion piece is DORA metrics for Azure DevOps — a platform that holds nearly all the delivery data and still computes none of it. For the honest limits of the four keys themselves, see DORA metrics without gaming them.