Planning accuracy
Say-do ratio: how to calculate it, chart it, and read it honestly
The short version.
- The say-do ratio is the percentage of work a team committed to at sprint start that was actually done by sprint end.
- A healthy range is 80–90% sustained — not 100%, which usually means sandbagged commitments, not perfect delivery.
- The data is already in your tracker: Jira sprint commitments or Azure DevOps iterations. No new process needed.
- It is a forecasting metric, not a productivity one — it tells you whether the team's dates can be trusted.
- Read the trend across sprints, never a single sprint — one bad bar is noise, six declining bars is a conversation.
What the say-do ratio measures
"Say" is what the team committed to at planning. "Do" is what actually reached Done by the sprint review. The ratio between them is the simplest honest answer to a question every stakeholder asks eventually: when this team says five things will be done in two weeks, how many actually are?
That makes it a reliability metric rather than an output metric. A team with a 85% say-do ratio is a team you can plan a release around. A team bouncing between 40% and 110% might be working just as hard — but nobody can build a schedule on their word, and that is the actual cost.
How to calculate it
- Take a closed sprint — Jira sprint or Azure DevOps iteration, it must be closed so the final states are settled.
- Count the commitment: the issues in the sprint's committed scope at the start. In Jira, the sprint's committed issues; in ADO, the work items assigned to the iteration.
- Count the delivery: how many of those reached Done, Closed or Resolved by the sprint end date. Work added mid-sprint does not count on either side.
- Divide: delivered ÷ committed × 100. That is the sprint's say-do ratio.
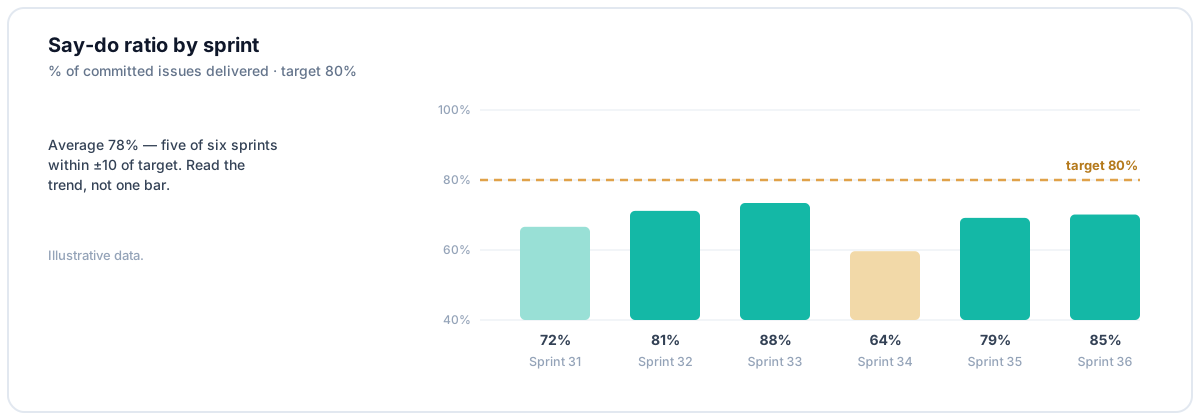
- Repeat per sprint and chart it — one bar per sprint against a target line. The chart is the report; the single number is nearly meaningless alone.
What a good number looks like (and why 100% is a warning)
The healthy range cited across planning literature and practitioner guides is 80–90%. Below that, commitments are fiction; at exactly 100% sprint after sprint, the team is committing to less than it can deliver — comfortable, but it quietly shrinks what the organisation ships and hides capacity your roadmap planning should know about. Both failure modes are planning problems. Neither is solved by pressing the team to "try harder."
Read it as a trend, at team level. One 60% sprint after a holiday is noise. Six sprints declining from 90% to 55% is a signal — scope creep, unstable intake, or estimates that no longer match reality. And attaching the number to an individual's review converts a forecasting tool into a gaming engine: people will hit 100% by saying nothing. For the wider argument, see DORA metrics without gaming them.
Where the report comes from
Everything the ratio needs — the commitment list and the final statuses — is already in Jira or Azure DevOps. For one team, a spreadsheet export and a pivot table will do. The spreadsheet stops scaling at roughly the second team: different boards, different workflows, different definitions of Done, and someone has to keep refreshing it every sprint.
That is the shape of problem Deckgauge exists for. Its Iteration Planning Accuracy widget computes the say-do ratio per closed Jira sprint or Azure DevOps iteration, plots it against the 80% target line, and keeps it current automatically — alongside the rest of the delivery picture (DORA, flow, review queues) from the same tracker history, read-only. The point is not the arithmetic; the arithmetic is easy. The point is a chart that is always right when the planning meeting starts.
Common mistakes
- Counting added work as commitment. Scope added mid-sprint belongs to neither the say nor the do — mixing it in makes the ratio say something else entirely.
- Judging single sprints. The ratio is a trend instrument; one bar answers nothing.
- Using it as a productivity scorecard. It measures the reliability of the word, not the amount of the work.
- Ignoring 100%. Sustained perfect delivery is a capacity-planning finding, not a trophy.
- Comparing teams on it. A team doing exploratory work will always run lower than one doing maintenance; the comparison punishes the assignment, not the team.
Frequently asked
- What is a good say-do ratio?
- Between 80% and 90%, sustained. Multiple practitioners and planning guides converge on this range: high enough that commitments are reliable, low enough that the team is not sandbagging. A team that consistently hits ~100% is committing to less than it can do — which is its own problem, just a different one.
- How do you calculate the say-do ratio?
- Take the issues committed at the start of a sprint. Count how many reached Done, Closed or Resolved by the end. Divide. That percentage is the say-do ratio for that sprint. Plot one bar per sprint against a target line (80% is the common choice) and read the trend, not the single sprint.
- Where does the data for a say-do ratio report come from?
- From the tracker: Jira sprint commitments and final statuses, or Azure DevOps iteration work items. Both hold what you need — the commitment list and the outcome — so the report needs no new process, only the query. Any tool that reads sprint history can produce it; a spreadsheet export works for one team, and stops working across ten.
- Is the say-do ratio a productivity metric?
- No, and treating it as one breaks it. It does not measure how much a team delivered — a team can have a perfect say-do ratio while shipping almost nothing, by committing to almost nothing. It measures whether the team’s word is good: a forecasting metric that makes roadmap dates trustworthy. Improve it by committing realistically, not by working harder.
- What is the difference between say-do ratio and sprint planning accuracy?
- They are the same measurement with different framing. “Say” is the commitment, “do” is the delivery; sprint planning accuracy is the same percentage described from the planning side. You will see both terms — plus commitment reliability — used interchangeably across Jira, Azure DevOps and agile literature.
If you track planning reliability, the adjacent questions are what the quarter actually bought and how to measure engineering productivity without breaking the team.