Org trees
An org tree is your team hierarchy — imported from Microsoft Entra/Graph or a CSV — layered with contribution insight from the same connected sources that feed your boards.
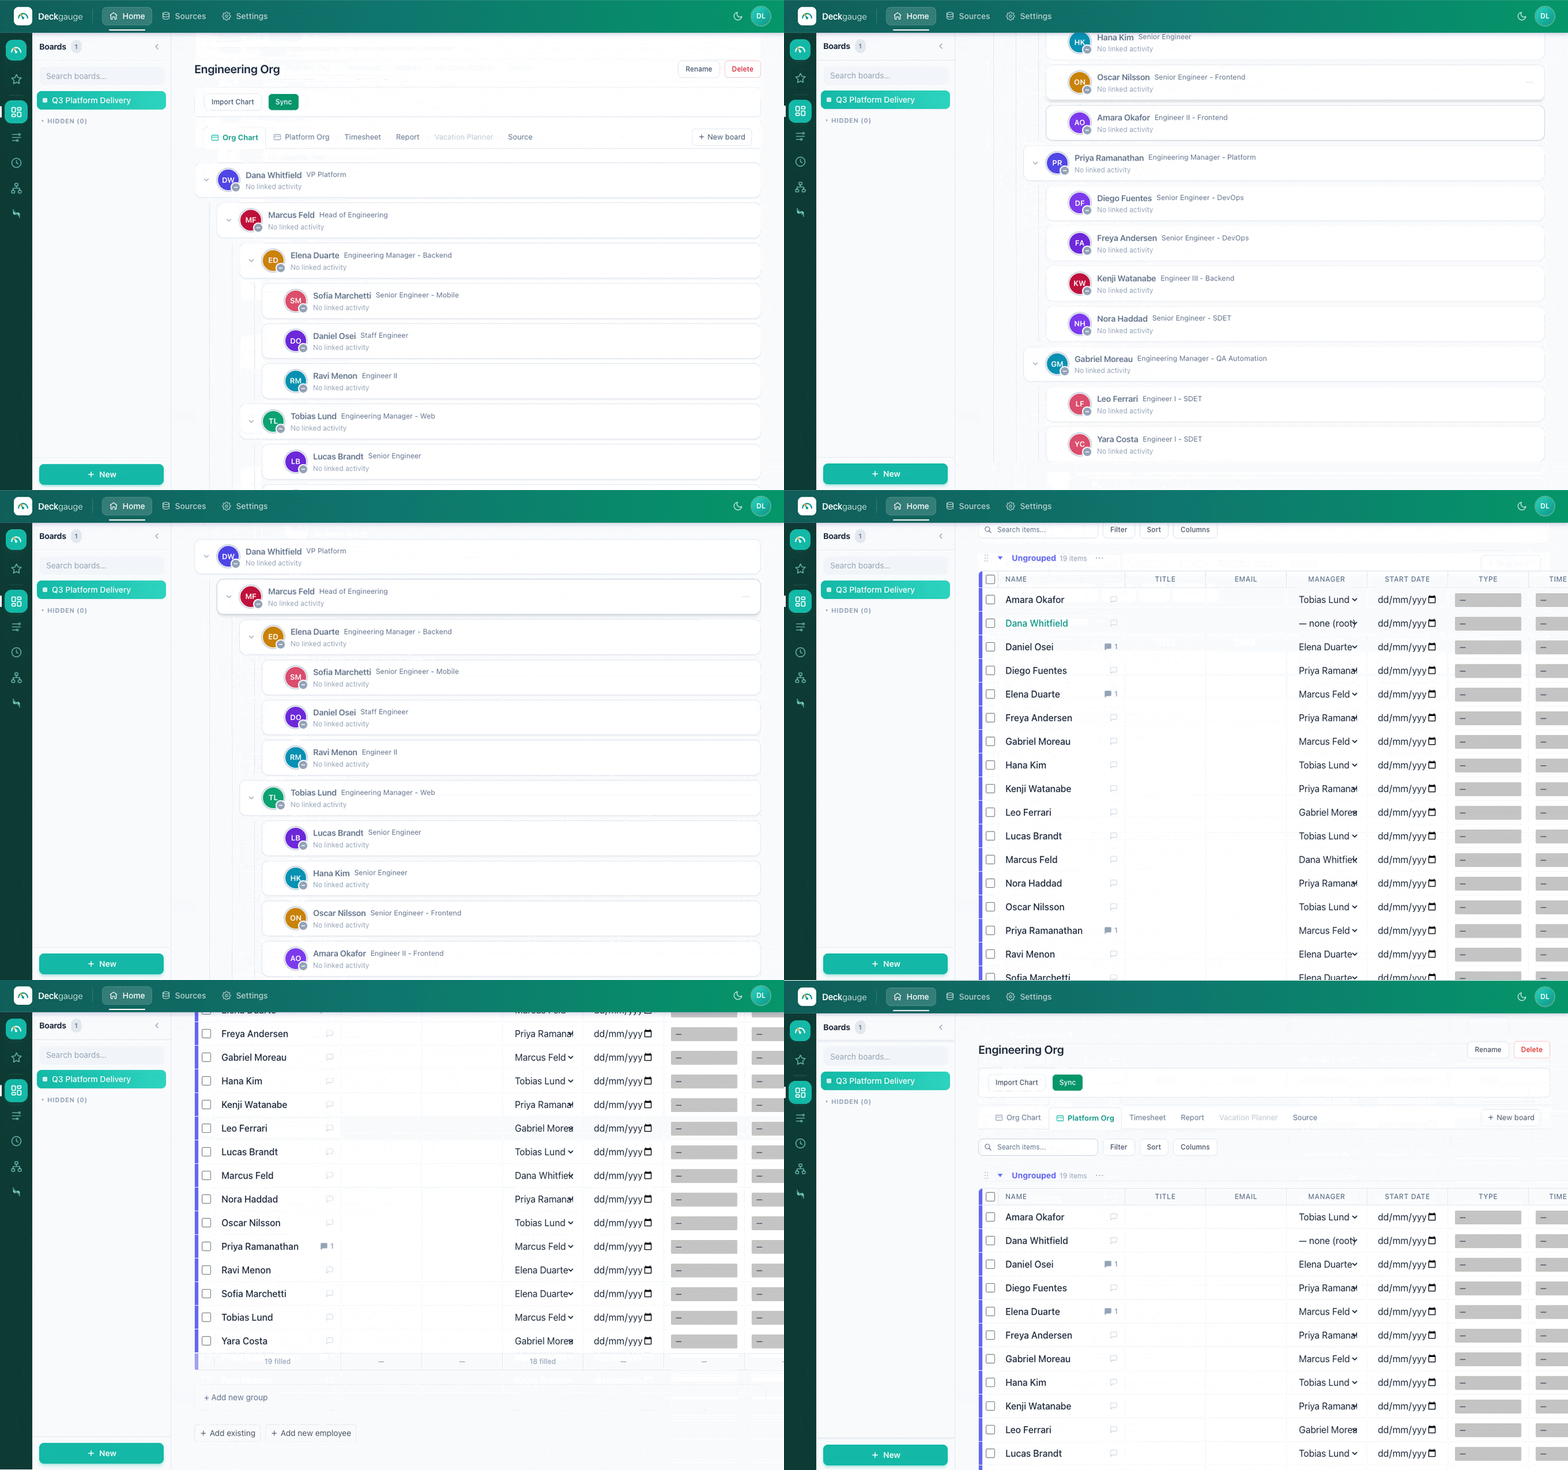
A hierarchy rooted at a chosen person.
Building the tree
- Microsoft Graph: in the tree's Source tab, paste a Graph Explorer access token and pick a root person — everyone reporting up to them is imported. See Connecting sources.
- CSV import: upload a roster (name, email, role, manager) — no Microsoft account required.
Each person node shows name, role, manager, and location, with a detail drawer for profile fields (and salary, if you're permitted to see it). Aliases map a person's GitHub login, Jira display name, and emails together so their activity is attributed correctly across tools.
Contribution ranking
The Ranking tab scores each person 0–100 over the last 90 days, relative to everyone on the tree, and shows their rank (#N of total). The score is a weighted blend of four metrics:
| Metric | Weight | Source |
|---|---|---|
| Tickets closed | 35% | Jira / ADO work items |
| PRs merged | 30% | GitHub / GitLab / ADO |
| Commits to main | 20% | GitHub / GitLab / ADO |
| Review comments | 15% | GitHub / GitLab / ADO |
Each metric is normalized 0–100 across the tree, then weighted; the panel shows the raw count, subscore, weight, and weighted points so the total is transparent. People with no matched activity show "Not ranked."
Employee boards
Inside a tree you can create employee boards — a board scoped to the tree's people, with configurable columns and custom cells, bulk actions, sorting, and filtering. Useful for headcount planning, onboarding trackers, or team rosters.
Timesheet view
The tree's Timesheet and Report tabs show CapEx/OpEx time allocation for its people — see Timesheet & workload.