Azure DevOps
DORA metrics for Azure DevOps: what ADO gives you, and what it doesn't
The short version.
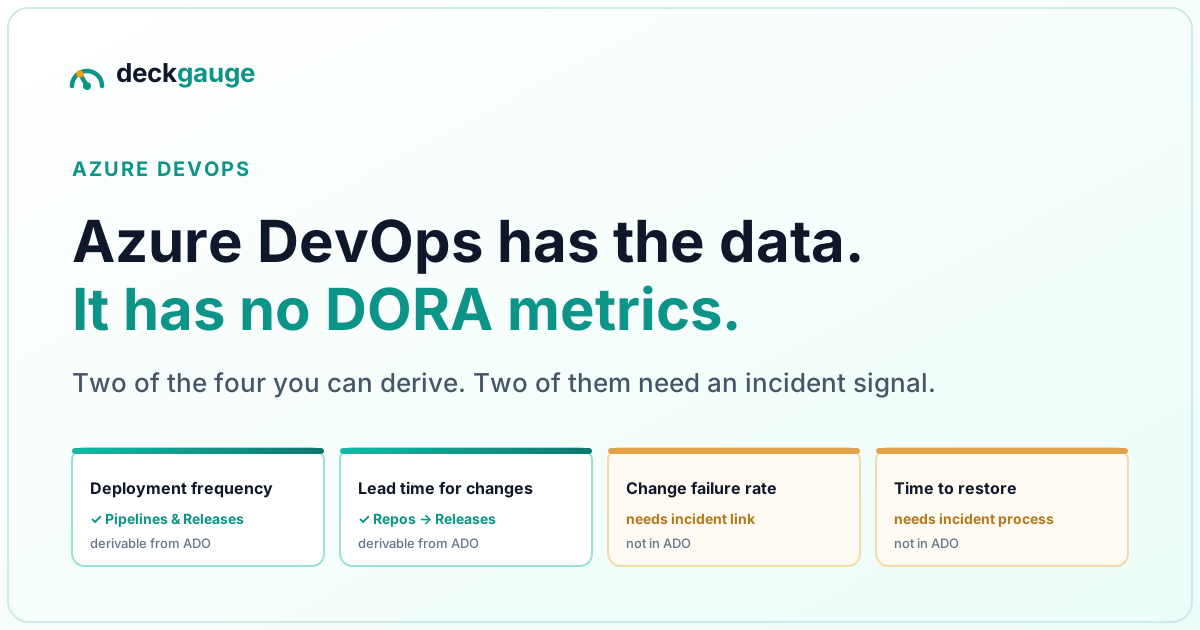
- Azure DevOps does not compute DORA metrics. It ships Analytics views and dashboard widgets, not the four keys.
- It does hold almost all the raw material: Repos, Pipelines, Releases and Boards.
- Deployment frequency and lead time for changes are derivable from ADO data alone.
- Change failure rate and time to restore are not — both need to know which deploy broke production, and ADO does not record that.
- Anyone claiming all four straight out of Azure DevOps has quietly redefined two of them. Ask which.
What are DORA metrics, and where does Azure DevOps hold the data?
The four DORA metrics measure software delivery performance: deployment frequency (how often you ship to production), lead time for changes (how long a commit takes to reach production), change failure rate (what share of deployments cause a degradation needing remediation), and time to restore service (how long recovery takes). They come from the DORA research programme, now published as the annual DORA State of DevOps report.
Azure DevOps is unusually well placed to answer them, because it holds both ends of the delivery pipeline in one product — which is exactly why the gap is frustrating:
| DORA metric | Where the data lives in ADO | Derivable from ADO alone? |
|---|---|---|
| Deployment frequency | Pipelines runs and Releases — each successful production deployment is a record with a timestamp | Yes |
| Lead time for changes | Repos (commit timestamp) joined to the Pipelines/Releases record that carried it | Yes, once you define which stage counts as production |
| Change failure rate | Nothing records "this deployment caused a problem". Closest proxies: failed pipeline runs, or Boards work items typed as bugs or incidents | No — needs an incident signal you supply |
| Time to restore service | Only if you open and close incident work items in Boards with reliable timestamps | No — needs an incident process, not just a tool |
Why do two of the four resist measurement?
Because they are not really about deployments — they are about failure, and failure is a judgement your organisation makes, not an event your CI system emits. A pipeline that goes red is not a change failure: it never reached production, so it is the system working. A pipeline that goes green and takes checkout down for forty minutes is a change failure, and Azure DevOps has no idea.
This is why so many "DORA for Azure DevOps" dashboards quietly substitute pipeline failure rate for change failure rate. The numbers look plausible and move in believable directions. They measure something real — build and release reliability — but it is not the DORA metric, and it will tell you your delivery is healthy on the same week you had three production incidents. If you take one thing from this page, take this: before trusting a change failure rate, find out what it counts.
The honest fix is process, not tooling. To measure change failure rate you need a rule your team actually follows — for example, every production incident gets a work item of a specific type, opened when detected and closed when resolved, with the deployment it followed noted on it. Once that rule holds, both remaining metrics fall out of the data. No tool can install the rule for you.
What are the options for Azure DevOps, and what do they cost you?
The field splits into four shapes, and the trade-off in each case is about where the data lives and how far it can see:
| Approach | Good for | Where it hurts |
|---|---|---|
| Marketplace extension — a DORA widget inside ADO | Fastest possible start; nothing to host; lives where your team already works | Scoped to what one project can see. Cross-project or cross-tool reporting is awkward to impossible, and you inherit the extension's definitions |
| Power BI over Analytics | Total control of definitions; joins to business data; likely already licensed | You are building and maintaining a data model. The four keys are a project, not a checkbox |
| Commercial SaaS — Datadog, Keypup, LinearB, Jellyfish and similar | Polished, supported, usually broader than DORA alone | Per-seat or per-contributor pricing, and your commit and work-item history sits in a vendor's cloud |
| Self-hosted tools | No per-seat cost; data stays on your infrastructure; definitions are auditable because you can read the code | You run it, upgrade it and back it up. Azure DevOps support is thinner than GitHub support across most of this category |
That last row is worth dwelling on, because it is the real gap in this space. Most tools in this engineering-metrics category were built GitHub-first, and Azure DevOps arrived later as a secondary connector — which shows up as shallower work-item support, missing release data, or a repo scope you cannot control. If you are an ADO shop, check the Azure DevOps connector specifically rather than the feature list on the front page.
How does Deckgauge handle Azure DevOps?
Deckgauge is a source-available, self-hosted engineering intelligence platform, and Azure DevOps is a first-class source rather than an afterthought. Being specific about what it does and does not do:
- Work items sync per attached project. Attach an ADO project to a board and
its work items flow in — name, status, owner, description and the work item's
Microsoft.VSTS.Scheduling.DueDate— alongside issues from Jira, GitHub or GitLab on the same board. - Pull request and commit analytics are strictly opt-in. They stay off until you enable code intelligence on the board source and switch on PR and/or commit sync for the project, scoped to either a named repo list or an explicit "all repositories" toggle. There is no wildcard, and a newly attached project pulls no code data at all until you say so.
- Deployment frequency comes from Pipelines and Releases, with which stages count as production decided when the metric is read rather than baked in at ingest — so changing your mind about what production means does not require re-syncing history.
- Change failure rate is not conjured from pipeline failures. Consistent with the section above, Deckgauge will not report a change failure rate it cannot substantiate rather than substitute a proxy that looks like one.
- Status history drives flow metrics. Cycle time, throughput and in-progress time come from the work item's revision history, not from a single current status, so a ticket that bounced between states is measured as it actually moved.
It is free, source-available under the Functional Source License, has no per-seat pricing, and runs on your own infrastructure with Docker. The full Azure DevOps connection guide covers the token scopes, the opt-in switches and the failure modes in detail.
How to measure what you can, step by step
The honest version of DORA on Azure DevOps is a Saturday afternoon, not a quarter — if you stay inside what ADO actually holds. Here is the path:
- Write down your production stages. In Pipelines, note which
stage/environment names mean production (e.g.
Deploy Prod, theProductionenvironment in Releases). This one sentence is the definition every number below inherits. - Deployment frequency from Pipelines. In Analytics views or a Power BI
query over the
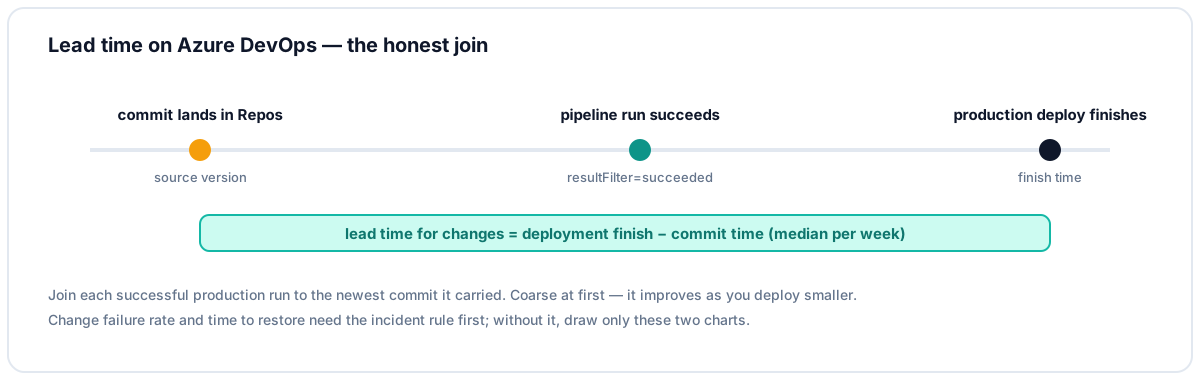
Pipelinesentity set, count runs of your production pipeline with resultSucceeded, grouped by day or week. Or query the REST API:GET https://dev.azure.com/{org}/{project}/_apis/build/builds?resultFilter=succeededand filter to your deploy definition. - Lead time by joining commit to deployment. For each successful deployment, take the newest commit it carried (the run's source version) and the deployment's finish time. The median difference, per week, is your lead time for changes. Coarse — it misses everything older than the oldest commit in the deploy — but honest, and it improves as you deploy smaller.
- Draw the two charts and stop there for a month. Deployment frequency as a count per week, lead time as a weekly median. Do not publish change failure rate or time to restore yet — you have no incident signal, and a made-up number crowds out the real one you will build later.
- Then install the incident rule. One work item type (Bug or Incident) in Boards, opened at detection, closed at resolution, with the deployment it followed in the description or a link field. Thirty days of that discipline, and change failure rate and time to restore fall out of the same queries.
How do you set this up without lying to yourself?
- Define production once, in writing. Name the pipeline stages or release environments that count. Every metric below inherits this decision, and teams that skip it spend the next quarter arguing about the numbers instead of the delivery.
- Start with the two you can actually measure. Deployment frequency and lead time for changes need no new process. Get them right, watch them for a month, and resist reporting the other two until they mean something.
- Install the incident rule. One work item type, opened at detection, closed at resolution, linked to the deployment it followed. This is the whole cost of the remaining two metrics.
- Report at team level, as a trend. DORA metrics compare a team to its own past. Ranking teams against each other with them produces gaming, not improvement — a failure mode worth reading about in DORA metrics without gaming them.
- Check the definition your tool uses before you trust the chart. Especially change failure rate. Especially if it was easy to turn on.
Frequently asked
- Does Azure DevOps calculate DORA metrics natively?
- No. Azure DevOps ships Analytics views, dashboard widgets and Power BI connectivity, but it does not compute the four DORA metrics for you. It holds nearly all of the raw material — Repos for commits, Pipelines and Releases for deployments, Boards for work items — but joining those into deployment frequency, lead time for changes, change failure rate and time to restore is left to you or to a tool on top.
- Which DORA metrics can you get from Azure DevOps data alone?
- Two of the four cleanly. Deployment frequency comes straight from Pipelines and Releases, and lead time for changes is computable because ADO holds both ends of the window — the commit and the deployment that carried it. Change failure rate and time to restore both need to know which deployments caused a production problem, and that is an incident signal Azure DevOps does not record on its own.
- What is the difference between an Azure DevOps DORA extension and a self-hosted tool?
- A Marketplace extension renders inside Azure DevOps and is limited to what one project can see, which makes cross-project and cross-tool views hard. A self-hosted tool pulls ADO through its REST API into its own store, so it can join Azure DevOps to Jira, GitHub or GitLab in one view and keep history beyond ADO retention. The trade-off is that you run and upgrade it.
- Can you measure DORA across Azure DevOps and GitHub together?
- Only with a tool that ingests both, and only if you decide up front what a deployment means on each side. Teams frequently run ADO Boards with GitHub repos, or migrate from ADO to GitHub over months, and during that period a single-platform tool reports half the picture. Deckgauge connects Jira, GitHub, GitLab and Azure DevOps to one board for this reason.
- Do I need Azure DevOps Server, or does Azure DevOps Services work?
- Both expose the same REST API surface for this purpose. Deckgauge authenticates with a personal access token (or basic auth with a username) against your organization URL, so a cloud Azure DevOps Services organization and a self-hosted Azure DevOps Server both work, provided the token carries read scopes for Work Items and — if you want PR and commit analytics — Code.
If you are also pulling work items from Jira, the companion pieces are can you get DORA metrics from Jira? and DORA metrics from GitHub — the same honest accounting for the other trackers — and DORA metrics in GitLab, the one platform that computes them natively. For the wider field, see self-hosted DORA metrics: the options.