GitHub
DORA metrics from GitHub: what GitHub gives you, and what it doesn't
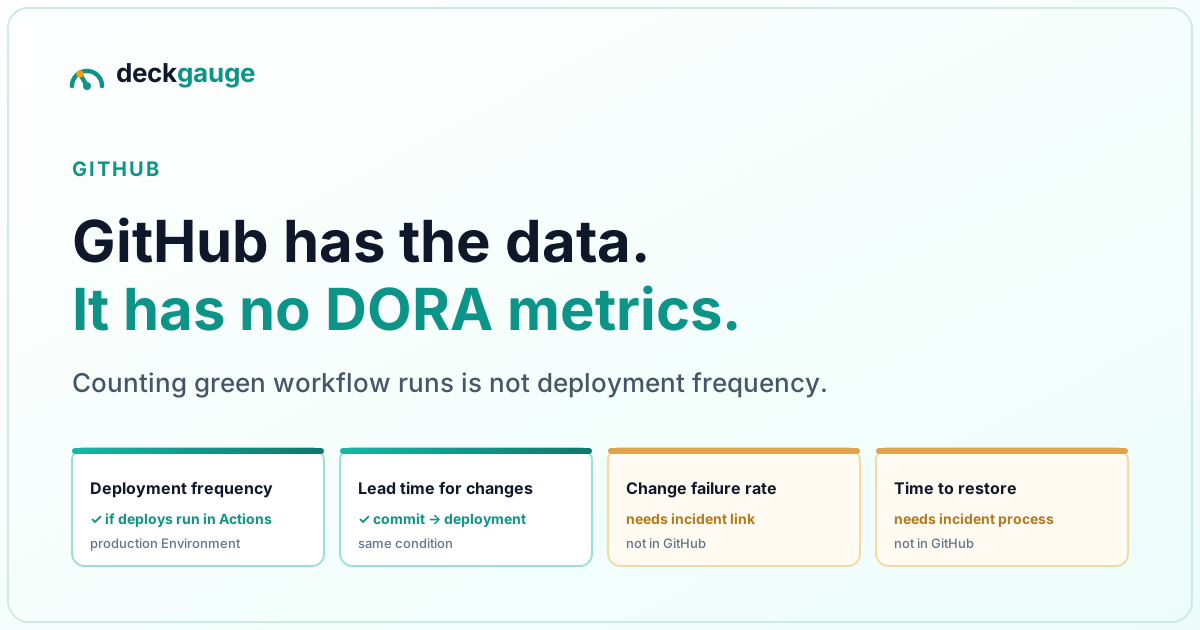
The short version.
- GitHub does not compute DORA metrics. It holds commits, PRs, workflow runs — raw material, not the four keys.
- If your deploys run through GitHub Actions to a production Environment, deployment frequency and lead time for changes are derivable from GitHub data alone.
- Change failure rate and time to restore are not — both need to know which deploy broke production, and GitHub records no such judgement.
- Most workflow runs are not deployments. Counting green runs as deploys inflates deployment frequency several-fold — the most common GitHub DORA mistake.
- The SaaS field serves GitHub-first shops best; the self-hosted field serves them worst. Check which side you are actually on before picking a tool.
What are DORA metrics, and where does GitHub hold the data?
The four DORA metrics measure software delivery performance: deployment frequency (how often you ship to production), lead time for changes (how long a commit takes to reach production), change failure rate (what share of deployments cause a degradation needing remediation), and time to restore service (how long recovery takes). They come from the DORA research programme, now published as the annual DORA State of DevOps report.
GitHub is where your code lives, which makes it feel like it should answer these questions. The reality is better than Jira's and worse than it looks:
| DORA metric | Where the data lives in GitHub | Derivable from GitHub alone? |
|---|---|---|
| Deployment frequency | Actions workflow runs targeting a production Environment (or the Deployments API, if you use it) | Yes, if deploys run through Actions with a named production environment |
| Lead time for changes | Commit timestamp joined to the workflow run or deployment that carried it | Yes, under the same condition |
| Change failure rate | Nothing records “this deployment caused a problem”. Closest proxies: failed workflow runs, or issues opened right after a deploy | No — needs an incident signal you supply |
| Time to restore service | Only if you open and close issues as incidents with timestamps you trust | No — needs an incident process, not just a tool |
The condition on the first two is the part teams miss. If production deploys do not run through GitHub Actions — you push from an external CD system, a platform team ships weekly from their own pipeline, or releases are manual — then GitHub holds neither end of the deployment window, and deployment frequency from GitHub data is a guess wearing a chart.
The most common GitHub DORA mistake: counting CI as deployment
A typical repository's Actions history is overwhelmingly not deployments. Test workflows fire on every pull request. Lint and typecheck fire on every push. A deploy workflow targeting staging is a deployment — to staging. Feed all of that into a counter and you get a deployment frequency several times higher than reality: green runs, not ships.
The clean pattern is GitHub Environments. A deploy job that declares
environment: production produces a deployment record GitHub itself tracks, with
a final status and a timestamp — and "successful runs of the production deploy workflow"
becomes a well-defined set rather than a filtering judgement call. Without that marker, every
DORA-over-Actions implementation quietly encodes a guess about which workflow is "the deploy
one", and reorganising your workflows silently rewrites your metrics history.
The honest fix for the other two is process, not tooling. Change failure rate needs a rule your team follows — every production incident gets an issue of a specific type, opened when detected, closed when resolved, with the deployment it followed noted on it. Once that rule holds, both failure-side metrics fall out of data you already have. No tool can install the rule for you, and any dashboard that shows all four keys without asking about your incident process has substituted a proxy for two of them.
What are the options for a GitHub DORA dashboard?
The field splits into four shapes:
| Approach | Good for | Where it hurts |
|---|---|---|
| Script it yourself — GitHub API into a spreadsheet or SQLite | Zero cost; total control of definitions; a good one-quarter experiment | You own it forever. Filter drift, workflow renames and token rotation all become your metrics bugs |
| Commercial SaaS — Jellyfish, LinearB, Swarmia, Datadog and similar | Polished, supported, GitHub-first: the connector depth here is the best in the category | Per-seat pricing, and your commit and PR history sits in a vendor's cloud |
| Open-source data plumbing — Apache DevLake into Grafana | Free, self-hosted, flexible data model | You build and maintain the dashboards; the product is the database, not the picture |
| Self-hosted product — source-available tools you run with Docker | No per-seat cost; data stays on your infrastructure; definitions auditable because you can read the code | You run and upgrade it. Check the PR- and commit-level depth, not the front-page feature list |
That middle distinction matters more for GitHub shops than for any other platform. The SaaS category was built GitHub-first, so per-seat cloud tools are at their strongest exactly here — and the free/self-hosted alternatives are correspondingly thinner. If you are evaluating the last row, the test is not "does it connect to GitHub" but whether it reads pull-request reviews, commit history and cross-repo work items deeply enough to drive flow and review metrics, or stops at issue counts.
How does Deckgauge handle GitHub?
Deckgauge is a source-available, self-hosted engineering intelligence platform, and GitHub is its most common code source. Being specific about what it does and does not do — the same honesty this page applies to GitHub itself:
- Pull requests, reviews, commits, issues and milestones sync per repo, each repo chosen independently for whether it feeds board issues, code intelligence, or both.
- Code intelligence is strictly opt-in per repo. A newly added repo pulls no PR or commit data at all until you switch it on — there is no wildcard, no "all repos" default.
- Flow, review and throughput metrics come from that PR and commit history: review wait, cycle time, in-progress counts, AI-assisted PR share, per-engineer workload — the delivery-side picture GitHub data genuinely supports.
- Deployment frequency comes from Azure DevOps Pipelines and Releases, where the deployment record is a first-class object. Deckgauge does not guess deployments from GitHub Actions runs today — an Actions/Deployments connector is the honest path to GitHub-sourced deployment metrics, and we would rather ship that than a proxy.
- Change failure rate is not conjured from failed workflow runs, for the same reason this page keeps repeating: a red CI run never reached production, so counting it as a change failure measures your build system, not your delivery.
It is free to self-host, source-available under the Functional Source License, has no per-seat pricing, and runs on your own infrastructure with Docker. The full GitHub connection guide covers token scopes, SSO authorization, and the per-repo opt-in switches.
How do you set this up without lying to yourself?
- Find out where your deploys are actually recorded. If they run through Actions to a production Environment, GitHub answers the two throughput metrics. If they don't, no GitHub-only tool can — and the honest move is connecting the system that does hold them.
- Start with the two you can measure. Deployment frequency and lead time for changes need no new process. Watch them for a month before reporting anything else.
- Install the incident rule — one issue type, opened at detection, closed at resolution, linked to the deployment it followed. That rule is the entire cost of the failure-side metrics.
- Report at team level, as a trend. DORA metrics compare a team to its own past; ranking teams against each other with them produces gaming, not improvement — see DORA metrics without gaming them.
- Ask any dashboard what its "deployment" means before trusting it. If the answer is "successful workflow runs", it is counting your CI.
Frequently asked
- Does GitHub calculate DORA metrics natively?
- No. GitHub holds the raw material — commits, pull requests, workflow runs and (if you use Environments) deployment records — but computes none of the four DORA metrics for you. Actions insights and workflow analytics show you build health, not deployment frequency, lead time for changes, change failure rate or time to restore.
- Which DORA metrics can you get from GitHub data?
- Deployment frequency and lead time for changes, if your deploys run through GitHub Actions to a named production Environment — both ends of the window (commit timestamp, deployment timestamp) then live in GitHub. Change failure rate and time to restore still need an incident signal GitHub does not record: nothing in a workflow run tells you a deploy took checkout down for an hour.
- How do you calculate DORA metrics from GitHub Actions?
- Count successful runs of your production deploy workflow that target a production environment — not every green run, or you will count lint and CI and inflate deployment frequency several-fold. For lead time, link each deploy to the commits it carried and measure from commit authorship to deployment. The two failure-side metrics need incidents recorded outside GitHub and joined to deploys by hand.
- What does a GitHub DORA dashboard cost — SaaS vs self-hosted?
- The SaaS engineering-intelligence tools (Jellyfish, LinearB, Swarmia and similar) are per-seat or per-contributor and hold your commit history in their cloud. Self-hosted options are free of per-seat cost and keep the data on your infrastructure, at the price of running and upgrading the tool yourself. A GitHub-first shop is the best-served segment of the SaaS category, so check any self-hosted alternative actually reads pull-request and commit history deeply enough for review and flow metrics, not just issue counts.
- Can you measure DORA across GitHub and Jira or Azure DevOps together?
- Only with a tool that ingests both. Teams frequently run Jira for work items with GitHub for code, or migrate between Azure DevOps and GitHub over months, and a single-platform tool reports half the picture during those periods. Defining what counts as a production deployment on each side has to happen before the numbers are joined, or the combined metrics silently mix definitions.
The companion pieces in this series: DORA metrics for Azure DevOps — where the deployment record does exist natively — and can you get DORA metrics from Jira?, the tool that holds the least of the picture. For the wider field, see self-hosted DORA metrics: the options.