GitLab
DORA metrics in GitLab: what you get, what it costs, and what it quietly assumes
The short version.
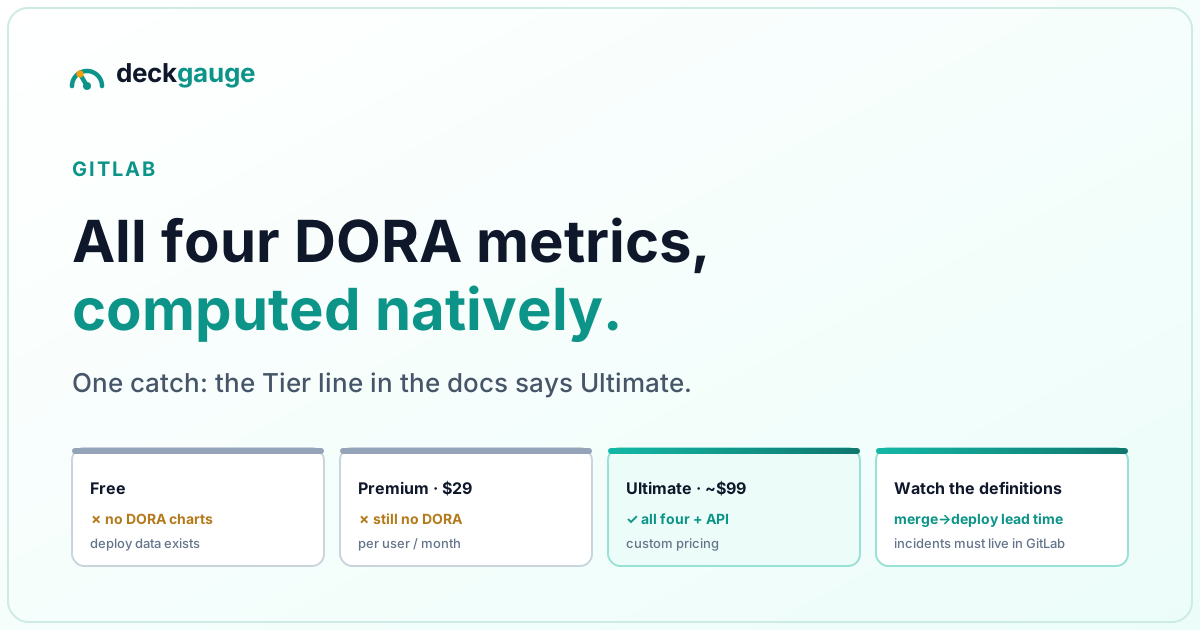
- GitLab is the only one of the four major trackers that computes all four DORA metrics natively — deployment frequency, lead time, change failure rate, time to restore — with charts and a REST API.
- It is an Ultimate-tier feature. On Free or Premium — including self-managed — the charts and the DORA API do not exist.
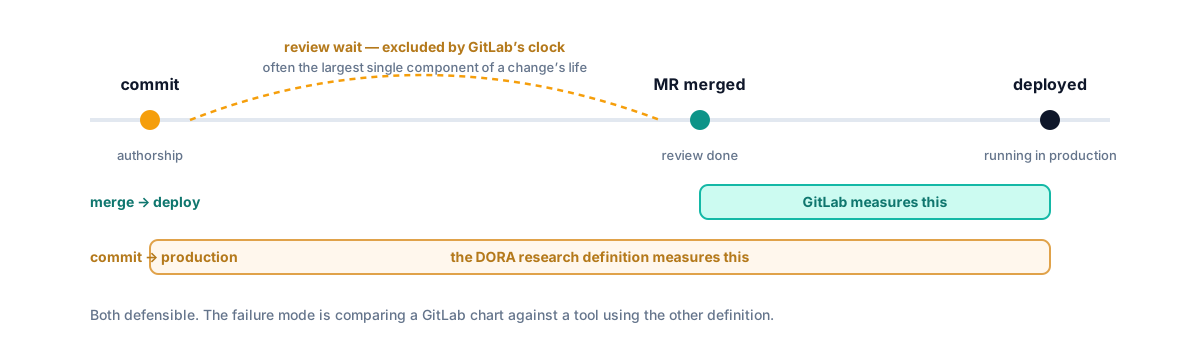
- GitLab’s lead time is merge-to-deploy, not the DORA report’s commit-to-production. Smaller number, different definition — know which one you are reading.
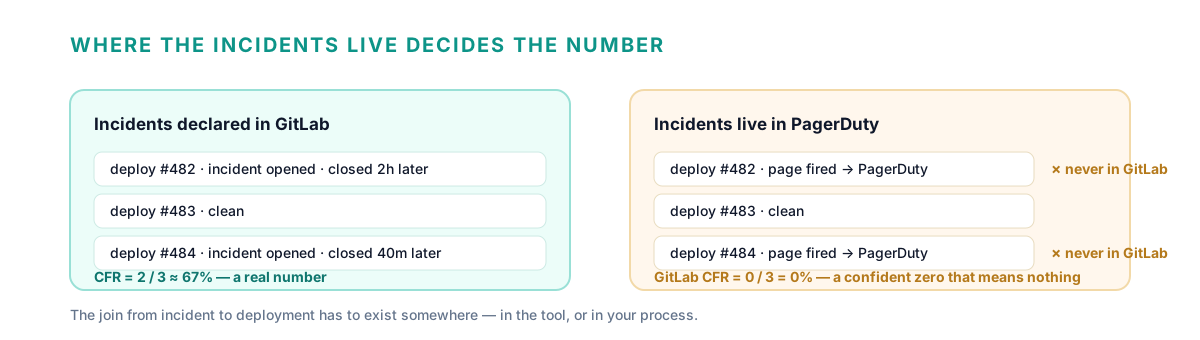
- Change failure rate counts incidents declared inside GitLab. If your incidents live in PagerDuty, the chart reads a confident zero.
- On Free or Premium your honest options: compute the metrics from GitLab’s own deployment data via the API, or run a tool alongside that does.
The one platform in this series that ships the four keys
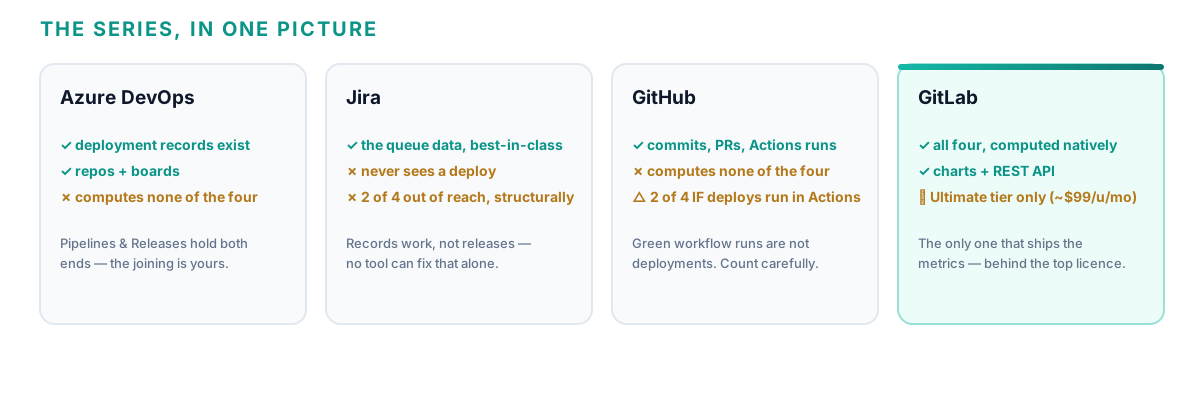
This is the fourth and final piece in a series applying the same honest accounting to each tracker — after Azure DevOps, Jira and GitHub — and GitLab is where the story inverts. Azure DevOps holds the data and computes nothing. Jira cannot even see the deployment. GitHub gives you the raw material if your deploys run through Actions. GitLab computes the metrics for you, at project and group level, and exposes them through a REST API as well as charts.
So why is anyone still reading? Because of the line above the feature in GitLab’s own documentation: Tier: Ultimate.
| DORA metric | GitLab’s implementation | What it assumes |
|---|---|---|
| Deployment frequency | Successful deployments to the production environment tier, counted per day (Ultimate) | Environments are actually tagged production/prod — an untagged environment is invisible to the metric |
| Lead time for changes | Median seconds from MR merge to the MR’s commits running in production (Ultimate) | Review wait is excluded by definition — this is merge-to-deploy, not commit-to-deploy |
| Change failure rate | Incidents ÷ deployments, production only (Ultimate) | Someone declares and closes incidents inside GitLab |
| Time to restore service | Median time an incident was open (Ultimate) | Same incident discipline — opened at detection, closed at resolution |
What Ultimate actually costs, and who is not on it
GitLab’s pricing page lists Premium at $29 per user per month (billed annually) and Ultimate at “custom pricing” — about $99 per user per month at list for GitLab.com, with self-managed negotiated per contract. For a 50-developer organisation, Ultimate is a five-figure monthly line item, and DORA metrics are one feature among the security-scanning and compliance suite you are buying with it.
The consequence is that most GitLab installations — Free tier groups, self-managed Community Edition, and plenty of Premium shops — have the raw material and not the metrics. The deployments exist as CI jobs targeting an environment on every tier; the aggregation into the four keys is what sits behind the licence. If you are on Free or Premium, nobody at GitLab is pretending otherwise — the docs are explicit — but the search results for “DORA metrics GitLab” are not, and that gap is what this page exists to fill.
The two definitions worth arguing about before the numbers
Lead time. GitLab starts the clock at merge, the DORA research programme starts it at commit authorship. The difference is review wait — often the largest single component of a change’s life. Both numbers are legitimate; the failure mode is comparison. A GitLab chart next to a tool that measures commit-to-production will show the same process as dramatically faster, and the discrepancy is definitional, not operational. Whose definition you adopt matters less than adopting one and labelling it.
Change failure rate. GitLab’s number is only as real as your team’s habit of declaring incidents inside GitLab. Teams that run PagerDuty, Opsgenie or a separate incident tracker alongside GitLab get a change failure rate of zero — not because nothing fails, but because GitLab never hears about it. This is the same rule the rest of this series keeps arriving at: the failure-side metrics are a process commitment first and a tool feature second.
If you are on Ultimate, use it. Native DORA with an API, computed from data GitLab already holds, beats any bolt-on. The honest checklist is short: tag your production environments, declare incidents in GitLab, and remember the lead-time clock starts at merge. This page is for everyone not on Ultimate — which is most GitLab installations.
What are the options off-Ultimate?
| Approach | Good for | Where it hurts |
|---|---|---|
| Compute from the API yourself — deployments + incidents into your own store | Total control of definitions; no new vendor; works on Free | You own it forever — environment tagging, incident joins and definition drift become your bugs |
| Upgrade to Ultimate | Native charts, group-level rollups, supported by GitLab | Top-tier per-user pricing for one feature among many; annual commitment |
| Commercial SaaS — Jellyfish, LinearB, Swarmia and similar | Polished, cross-tool (GitLab + Jira + GitHub in one view) | Per-seat cost, and your MR and incident history sits in a vendor’s cloud |
| Self-hosted tool alongside GitLab | No per-seat cost; data stays on your infrastructure; works with any tier | You run it. Check MR-level depth and multi-tool joins, not the front page |
How does Deckgauge handle GitLab?
Deckgauge is a source-available, self-hosted engineering intelligence platform, and GitLab is one of its four sources. Being specific, as this series always is:
- Merge requests, issues, reviews and commits sync per project —
gitlab.com or self-managed, via an access token against
/api/v4. Commit sync is a genuine per-project toggle; MR and issue board feeds are independent switches. - Flow, review and throughput metrics come from that MR and commit history — review wait, cycle time, in-progress counts, per-engineer workload — on any GitLab tier, because it reads the data your tier already exposes.
- Deployment frequency comes from Azure DevOps Pipelines and Releases, where the deployment record is a first-class object. Deckgauge does not ingest GitLab CI deployments today, and this page is not going to claim otherwise — a tool that quietly counts CI jobs as production deployments repeats the exact mistake the GitLab docs guard against with environment tiers.
- Where GitLab already gives you DORA natively — Ultimate — use it. A platform that ships the four keys from data it already holds is the right answer, and Deckgauge’s role there is the cross-tool picture: GitLab plus Jira plus GitHub in one board, which native GitLab analytics does not cover.
It is free to self-host, source-available under the Functional Source License, and the full GitLab connection guide covers token scopes, self-managed base-URL normalization and the per-project toggles.
How do you set this up without lying to yourself?
- Check your tier before anything else. If you have Ultimate, the metrics are in the project and group analytics already — go tag your production environments and read them. If not, nothing in the GitLab UI will give you the four keys, and a search-result screenshot of the Ultimate charts is not a plan.
- Fix the environment tags now, whatever you run later. Deployment frequency — GitLab’s or anyone else’s — counts deployments to the production tier. An untagged environment makes deploys invisible to every tool that reads GitLab, including future-you.
- Pick one lead-time definition and label it. Merge-to-deploy or commit-to-deploy — either, but one, written down, so nobody compares across definitions next quarter.
- Decide where incidents live, and mean it. In GitLab incident management if you are staying native; in whatever your team actually uses if not — but the join from incident to deployment has to exist somewhere, or change failure rate is decorative.
- Report at team level, as a trend. As with every piece in this series — see DORA metrics without gaming them.
Frequently asked
- Does GitLab have built-in DORA metrics?
- Yes — GitLab is the only one of the four major trackers that computes all four DORA metrics natively, at project and group level, with a REST API. The catch is the tier: the feature requires GitLab Ultimate, the top plan. On GitLab.com Free, Premium, or a self-managed instance without an Ultimate licence, the DORA charts and the DORA API simply are not there.
- Can you get DORA metrics on GitLab Free or Premium?
- Not from GitLab itself. The deployment records exist on every tier — CI jobs that deploy to a production environment — but the aggregation into the four metrics is Ultimate-only. On Free or Premium your options are exporting the deployment and incident data through the API and computing the metrics yourself, or running a tool alongside GitLab that does it.
- How does GitLab define lead time for changes?
- GitLab measures the median time from a merge request being merged to that MR’s commits running in production — merge to deploy, not commit to deploy. The DORA research definition runs from commit authorship, so GitLab’s number is systematically smaller: it excludes the time a change spent waiting for review. Both definitions are defensible; the failure mode is comparing a GitLab chart against a tool that uses the other definition and concluding one process is faster.
- Where does GitLab’s change failure rate come from?
- From GitLab’s incident management: the metric is the number of incidents (declared, and closed, inside GitLab) divided by the number of production deployments in the period. That means it inherits the same rule every honest DORA implementation needs — someone must actually declare incidents in the tool. If your team tracks incidents in PagerDuty or a separate tracker and never opens GitLab incidents, GitLab’s change failure rate will read a confident zero that means nothing.
- Is the GitLab DORA API available on self-managed instances?
- Yes, with an Ultimate licence — the API and charts work on GitLab Self-Managed and GitLab Dedicated as well as GitLab.com, with project-level and group-level endpoints. The deployment data comes from CI jobs deploying to the production environment tier (or environments named production or prod), so environments must be tagged correctly for the metrics to mean anything.
The rest of the series: Azure DevOps — the data without the metrics; Jira — the work without the deploy; GitHub — the deployments if Actions carries them; and this page — the metrics, if the tier carries them. For the wider field, see self-hosted DORA metrics: the options.