Bitbucket
DORA metrics from Bitbucket: what Pipelines gives you, and what it doesn't
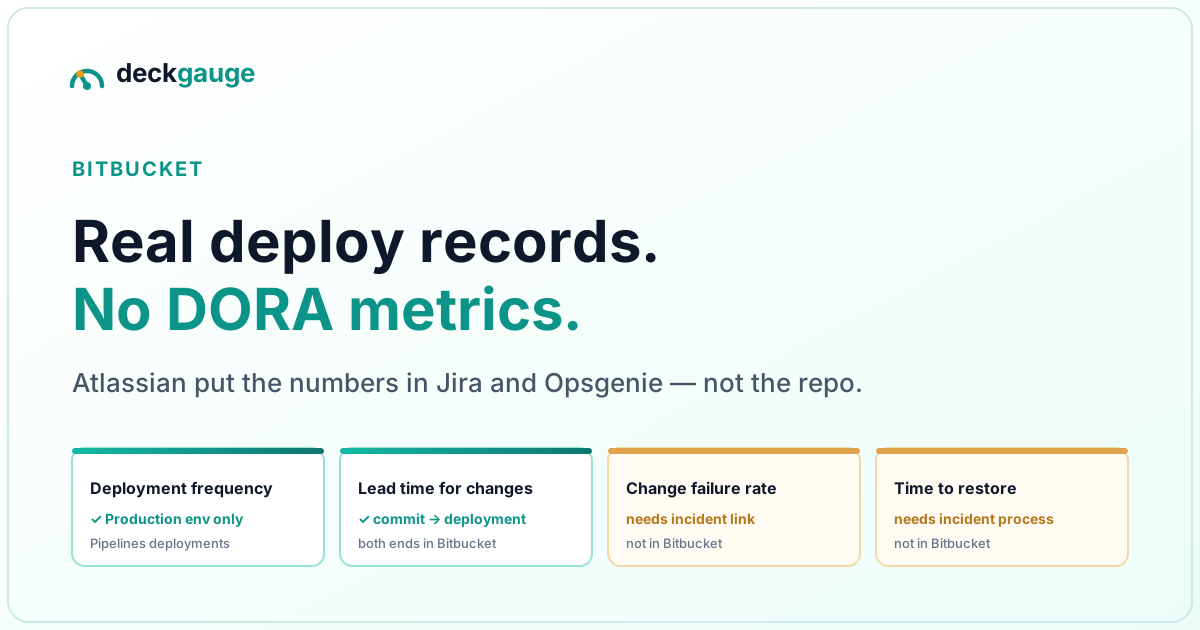
The short version.
- Bitbucket computes none of the four DORA metrics. Not on any tier, not anywhere in the repository — there is no DORA dashboard to find.
- What it does have is a real deployment record: Pipelines deployments against typed environments (Production / Staging / Test), exposed on a deployments REST API.
- Deployment frequency and lead time for changes are derivable from that record, once environment types are actually set.
- Change failure rate and time to restore are not — Bitbucket records no judgement about which deploy broke production. Atlassian routes those through Opsgenie incidents and alerts.
- The deployment record only exists if your
bitbucket-pipelines.ymluses thedeployment:property. Untyped or undeployed pipelines give you build history, not DORA data.
What are DORA metrics, and where does Bitbucket hold the data?
The four DORA metrics measure software delivery performance: deployment frequency (how often you ship to production), lead time for changes (how long a commit takes to reach production), change failure rate (what share of deployments cause a degradation needing remediation), and time to restore service (how long recovery takes). They come from the DORA research programme, published as the annual DORA State of DevOps report.
Bitbucket Cloud holds more of the raw material than Jira and less ambiguity than GitHub — if you use Pipelines with environments. Here is the honest ledger:
| Metric | What Bitbucket holds | From Bitbucket alone? |
|---|---|---|
| Deployment frequency | Pipelines deployments to environments typed Production, via the deployments API | Yes — if the deployment: property and environment types are set |
| Lead time for changes | Commits, PRs, and the deploy that carried them | Yes — commit-to-deploy needs the join, but both timestamps exist |
| Change failure rate | Deploy success/failure states | No — a successful deploy that later breaks production is invisible without an incident signal |
| Time to restore | Nothing | No — recovery time is an incident property; Bitbucket has no incident concept |
What Bitbucket actually records
Three things matter. First, deployment steps: a Pipelines step only becomes a
deployment record when your bitbucket-pipelines.yml uses the
deployment: property with a named environment. Second, environment
types: each environment in Repository settings → Deployments is typed Production,
Staging, or Test — the type decides what counts as a production ship. Third, the
Deployments REST API: GET /2.0/repositories/{workspace}/{repo_slug}/deployments
returns each deployment with its state and environment, and /environments lists
the environments themselves; both need the read:pipeline:bitbucket scope on an
API token.
That is a cleaner foundation than GitHub's, where every DORA implementation has to guess which workflow is "the deploy". In Bitbucket the guess is already made — a step either declares itself a deployment to a typed environment or it doesn't. The catch is that the declaration is opt-in: teams that never typed their environments have deployment history that no tool can honestly read as production ships.
What Bitbucket does with all this in-product is show it, not measure it: a Deployments page per repository, deployment status badges on pull requests, and per-commit "where is this deployed" visibility. No frequency trends, no lead time, no failure metrics.
Where Atlassian actually put the metrics
When Atlassian wanted DORA-shaped numbers over Bitbucket data, it built them in the adjacent products, not in Bitbucket:
- Jira Cloud's deployment frequency report. Per team, inside Jira, once your CI/CD tool is wired into Jira's development panel. It counts deployments (and shows the work items per deploy) — deployment frequency only. No lead time, no failure metrics, and it lives in Jira, not Bitbucket.
- Opsgenie's DevOps metrics. Deployment frequency, a change failure ratio (deployments over failures, where "failures" are incidents and alerts), and a mean-time-to-respond/resolve figure. It is the fullest Atlassian attempt at the set — and it is an incident-management product, fed by connecting your Bitbucket workspace to Opsgenie. If your team doesn't run on Opsgenie, these charts are theoretical.
So the honest answer to "does Bitbucket support DORA metrics" is: Bitbucket supplies the deployment record, Jira can count frequency per team, Opsgenie can approximate three of the four — and the assembly is left as an exercise for the buyer.
The two you can compute honestly
Deployment frequency is a count of successful deployments to Production-typed environments over the window. The rules that make or break it:
- Deployments to Staging or Test environments never count, no matter how often they run.
- A pipeline that deploys to several production environments — one per brand or region — is one deployment, not N. Counting it N times silently multiplies your frequency.
- Untyped environments read as nothing. This is the single most common reason a Bitbucket deployment frequency chart shows a flat zero.
Lead time for changes runs from commit authorship to the deployment that carried the commit. Both ends exist in Bitbucket — the commit is in the repo, the deployment names what it shipped — so the join is mechanical, and unlike GitLab's built-in metric (measured from merge, not commit) it can match the DORA research definition rather than a friendlier variant of it.
The two that need an incident signal
Bitbucket knows whether a deploy ran. It does not know whether a deploy that ran cleanly then took checkout down for an hour. Change failure rate needs that judgement attached to specific deployments, and time to restore needs the degraded-and-recovered interval around it. Neither exists anywhere in the Bitbucket data model.
Opsgenie's answer — incidents and alerts as the failure signal — works only as well as your alert hygiene: alerts that fire for things users never noticed inflate the failure rate; incidents declared in a tool Opsgenie never sees make it read a confident zero that means nothing. If your incidents live in PagerDuty, Jira Service Management, or a spreadsheet, the join to Bitbucket deployments is yours to build and maintain. This is the same wall every platform hits; Bitbucket just doesn't pretend otherwise, because it doesn't ship the metric.
The Bitbucket-specific traps
- Untyped environments. The Deployments page exists from the first
deployment:step, but the Production/Staging/Test type is what tools key on. Audit it once: Repository settings → Deployments, per repo. - Release PRs counted as work. A
develop → mainorrelease/2.4 → productionpull request is a release, not new work. If your throughput numbers include them, every release week looks like a productivity spike. - Scope confusion on tokens. A plain Atlassian API token (the kind Jira
uses) authenticates but is refused by Bitbucket. Deployments need
read:pipeline:bitbucket— created via Create API token with scopes, not the legacy form. App passwords are retired. - Cloud ≠ Data Center. The deployments API and environment typing described here are Bitbucket Cloud. Before assuming any of it on a self-managed instance, check — the surfaces differ.
What Deckgauge does with Bitbucket
Deckgauge connects Bitbucket Cloud with a scoped Atlassian API token and syncs, per repository: pull requests with line counts and linked Jira keys (180 days), approvals and comments, commits on the main branch (180 days), and Pipelines deployments (90 days). The deployments feed DORA deployment frequency, change failure rate and lead time; the rules above are enforced in the pipeline — Staging/Test never count, a multi-environment production pipeline counts once, and release PRs are stored but kept out of throughput and review metrics.
Work items are deliberately not taken from Bitbucket. Tasks live in Jira; Bitbucket pull requests link back to them by issue key. That split mirrors how the tools are actually used — and it is why a Bitbucket board view in Deckgauge is built on the Jira project attached to the same board, not on repository activity.
The full connection walkthrough — token scopes, the workspace auto-detection, picking repositories by project — is in the Bitbucket source guide.
What to do on Monday
-
Open Repository settings → Deployments for your production repos and check every
production environment is typed Production. Then verify your
bitbucket-pipelines.ymldeploy steps use thedeployment:property. -
Pull
/deploymentsfor one repo and eyeball a week: are the production ships there, and do the counts match what you'd defend in a review? - Decide where your incident signal lives before quoting any change failure rate. If the answer is "nowhere yet", that's the finding — see DORA metrics without gaming them.
Frequently asked
- Does Bitbucket have built-in DORA metrics?
- No. The repository gives you a Deployments page, deployment status on pull requests, and the deployments REST API — records, not metrics. The closest Atlassian surfaces are Jira Cloud’s deployment frequency report (needs the CI/CD dev-tools integration) and Opsgenie’s DevOps metrics, which report deployment frequency, change failure ratio and mean time to respond once your Bitbucket workspace is connected. Neither lives inside Bitbucket, and neither gives you all four DORA metrics from Bitbucket data alone.
- How do you calculate deployment frequency from Bitbucket Pipelines?
- Count successful deployments to environments of type Production. Two prerequisites: your bitbucket-pipelines.yml must use the deployment property on the steps that actually deploy, and each environment must have its type set to Production in Repository settings → Deployments. Deployments to Staging or Test environments never count. If your deployment frequency reads zero everywhere, an untyped environment is the first thing to check.
- Can you measure change failure rate from Bitbucket?
- Not from Bitbucket alone. Bitbucket knows when a deploy failed, but change failure rate asks which successful deploys later broke production — a judgement Bitbucket never records. You need an incident signal joined to deployments: Opsgenie uses incidents and alerts as its failure signal, which undercounts if alerts fire for things users never noticed. If your incidents live in PagerDuty or a tracker, the join happens outside Atlassian entirely.
- Is there a Bitbucket DORA metrics API?
- There is a deployments API, not a DORA API. GET /2.0/repositories/{workspace}/{repo_slug}/deployments returns each deployment with its state and environment, and /environments lists your environments; both need the read:pipeline:bitbucket scope on an API token. The aggregation — filtering to Production, joining commits, computing frequency and lead time — is yours to write.
- What does Deckgauge sync from Bitbucket?
- Pull requests with line counts and linked Jira keys (180 days), approvals and comments, commits on the main branch (180 days), and Pipelines deployments (90 days) — the deployments feed deployment frequency, change failure rate and lead time. Work items are not synced from Bitbucket at all; tasks stay in Jira, and pull requests link back by issue key. Release PRs (branch names like release/… or develop→main merges) are stored but excluded from throughput metrics, and a pipeline that deploys to several production environments counts as one deployment.
The companion pieces in this series: DORA metrics for Azure DevOps — where the deployment record also lives natively — GitHub, where every green run looks like a deploy, and GitLab, which computes all four but gates them behind Ultimate. For the wider field, see self-hosted DORA metrics: the options.