Engineering leadership
Engineering productivity metrics: the 12 worth tracking (and how to read them)
The short version.
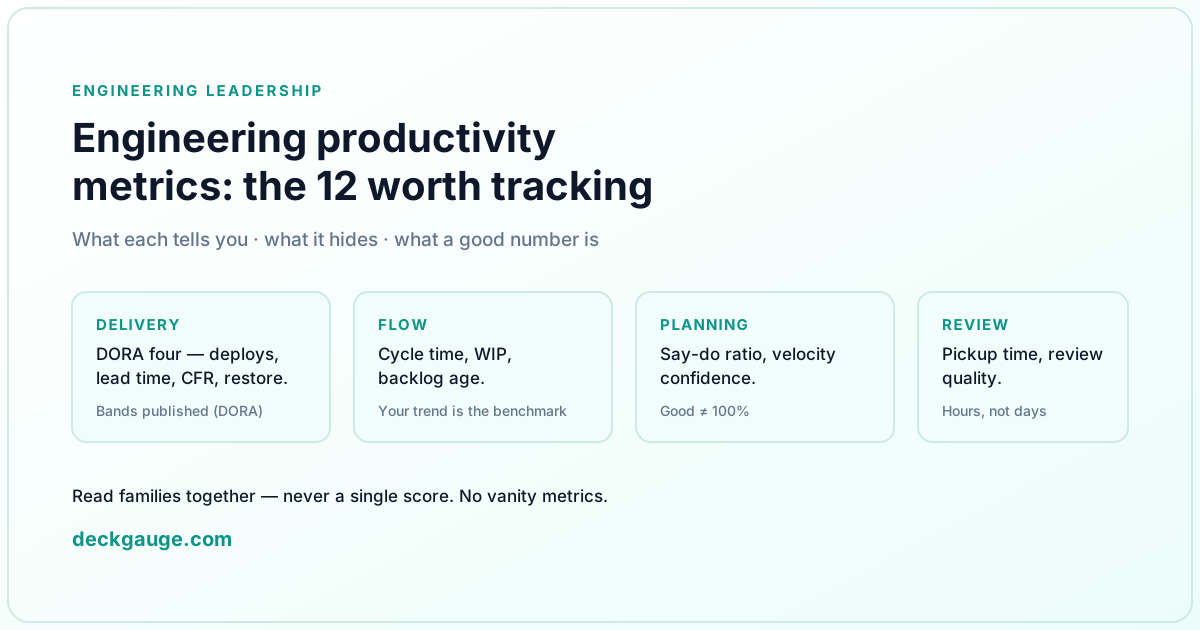
- Twelve metrics in four families cover engineering productivity honestly: delivery (DORA four), flow (cycle time, WIP, backlog age), planning (say-do ratio, velocity confidence), review (pickup time, review quality).
- Each metric answers exactly one question and hides the others. Read families together, never a single score.
- Every metric here fails the same way: attached to an individual, it gets gamed. The unit of productivity is the team's system of work.
- What a "good" number is depends on the family — delivery has published bands, flow only has your own trend, and planning tops out below 100%.
Most pages listing engineering productivity metrics are a vendor's dashboard screenshot with fifteen numbers and no warnings attached. This is the opposite: every metric that earns a place below gets three notes — what it tells you, what it quietly hides, and what a good number actually looks like. The metrics that fail that test (lines of code, commit counts, utilisation) are listed at the end, with the reason they fail.
If you want the process around these numbers — how to stand up a measurement programme without a revolt — that is a separate piece: how to measure engineering productivity. This page is the catalog. For one-line definitions of related terms, the engineering metrics glossary is the companion reference.
The list at a glance
| Metric | Family | Tells you | Hides | Source of truth |
|---|---|---|---|---|
| Deployment frequency | Delivery | How often production changes | Change size, quality | Deploy system |
| Lead time for changes | Delivery | Commit → production | Planning time upstream | Git + deploys |
| Change failure rate | Delivery | Share of deploys causing failure | Failure severity | Deploys + incidents |
| Time to restore service | Delivery | Recovery speed | How recovery happened | Incidents |
| Cycle time | Flow | Start → finish per item | Queue time before start | Tracker |
| Work in progress | Flow | Items in flight | Proximity to done | Tracker |
| Backlog age | Flow | How long unstarted work waits | Whether it should be done | Tracker |
| Say-do ratio | Planning | Commitments actually delivered | Effort or value | Tracker sprints |
| Velocity confidence | Planning | How stable the forecast base is | Estimate honesty | Tracker sprints |
| Review pickup time | Review | PR wait before first review | Review quality | Git provider |
| Review quality index | Review | Genuine review, not rubber stamps | Code correctness | Git provider |
| Roadmap focus | Focus | Share of effort on the roadmap | Whether the roadmap is right | Tracker + roadmap |
Delivery metrics: the DORA four
Deployment frequency, lead time for changes, change failure rate, time to restore service. These are outcome metrics: they measure what the delivery system produces, not how busy anyone was. The DORA research programme is the only source that publishes comparison bands (elite teams deploy on demand with lead times under a day — check the current DORA report for the exact thresholds), which makes this the one family where "good" has an external definition.
What the family hides: everything upstream of the commit. A team can deploy hourly and still spend 70% of its time on work nobody asked for. And the honesty condition is strict — deploys are witnessed only by the deployment system. We keep a per-tool accounting of what each tracker can actually supply: Azure DevOps, Jira, GitHub, GitLab.
Flow metrics: where work waits
Cycle time (work started → work finished), work in progress (items open and active now) and backlog age (how long unstarted items have waited) come from the tracker, because the tracker timestamps every status change. Their relationship is close to mechanical: hold throughput steady and cycle time rises with WIP. Rising WIP with flat throughput is the earliest visible sign a team is drowning — weeks before delivery metrics notice.
What a good number is: your own trend. Published cycle-time benchmarks are noise because review speed, release cadence and batch size vary by an order of magnitude across organisations. A healthy signal is a flat or falling trend with occasional outliers you can name. The WIP widget, flow and cycle-time trend and backlog age widget exist because these three are cheap to compute and almost never watched.
Planning metrics: can dates be trusted
Say-do ratio — the share of sprint commitments that shipped by sprint end — is the flagship. A sustained 80–90% is healthy; a sustained 100% means commitments are sandbagged, not delivery perfect. It is a forecasting metric: it tells stakeholders whether the team's word can be scheduled around. The deeper guide, including how to chart it honestly, is the say-do ratio post.
Velocity confidence reads the spread of recent sprints: if velocity swings ±60%, any date computed from its average is noise. The velocity confidence widget makes that explicit. What planning metrics hide: effort and value. A team at 100% say-do shipping trivial tickets is not more productive than one at 85% shipping the hard thing.
Review metrics: the queue nobody owns
Review pickup time (PR open → first review) and review quality (genuine approvals and written comments, not instant merges) measure the only queue in engineering that appears on no job description. Review delay is lead-time addition with no offsetting benefit; rubber-stamped approvals delete the safety that review exists to provide. Both are read straight from Git provider records — see the review pickup time and review quality index references.
Good numbers: pickup in hours, not days, with the spread narrowing over time. What they hide: whether the review caught anything — a fast, genuine review that misses a design flaw scores identically to one that catches it. Metrics cannot read code; that stays a human job.
Focus metrics: is effort going where the plan says
The families above measure how work moves; none of them checks which work. Roadmap focus — the share of engineering effort landing on roadmap items versus everything else that interrupted — is the antidote, and it is the number that most often surprises a VP. The roadmap focus widget and the investment allocation view exist for exactly this question. What it hides: whether the roadmap itself was right. Focus measures alignment, not strategy.
The metrics that did not make the list
- Lines of code, commit count, tickets closed per person. Inflatable without the product improving, and ranking individuals on them is a works-council and GDPR problem in much of Europe.
- Utilisation. Busy is not delivering; sustained high utilisation is how you guarantee queueing.
- Velocity compared across teams. Points are local currencies; there is no exchange rate.
- Any single "productivity score." Every composite hides which input moved it — and a tool selling you one score is selling you something gameable.
The full argument for why these fail — and what to do when a stakeholder asks for them anyway — is in measuring engineers without surveillance and DORA metrics without gaming them.
Frequently asked
- What are the best metrics for engineering productivity?
- A defensible starting set is six numbers read together: deployment frequency, lead time for changes and change failure rate for delivery; cycle time and work in progress for flow; review pickup time for collaboration. No single metric survives being a target — each one can be improved by sacrificing something it does not see, which is why they are read in families.
- How many engineering metrics should a team track?
- Fewer than most dashboards suggest. Four to six metrics that someone actually reviews each week beat forty that nobody reads. Add a metric only when a real decision is waiting on it, and retire ones that have never changed a decision — a metric nobody acts on is shelf-ware that discredits the useful numbers next to it.
- What is the difference between productivity metrics and delivery metrics?
- Delivery metrics (the DORA four) measure outcomes: how often code reaches production and how safely. Productivity metrics are the broader set including flow (where work waits), planning (whether dates hold) and review (how collaboration runs). Delivery metrics tell you how the system performs; the others tell you where to look when it does not.
- Can you measure individual developer productivity?
- You can count an individual’s output, but the number measures the wrong unit. One person’s numbers over one sprint are dominated by which tickets they happened to pick up; ranking people on them invites gaming, and in much of Europe ranking employees this way is a works-council and GDPR problem. Measure the team’s system of work and use conversations for individuals.
- Do DORA metrics measure productivity?
- Partly. DORA measures the performance of the delivery system — how fast change reaches production and how often it breaks. A team can score well on DORA while building the wrong thing, so pair DORA with planning metrics like say-do ratio and a focus measure to see whether effort is going where the roadmap says it should.
- What is a good cycle time for an engineering team?
- There is no universal good number — code review speed, release cadence and batch size move it. What matters is your own trend after outliers are excluded. Treat a sudden change in the trend as a question to investigate, not a verdict; the DORA report clusters lead-time performance into elite/high/medium/low bands, but the honest comparison is your team against itself.
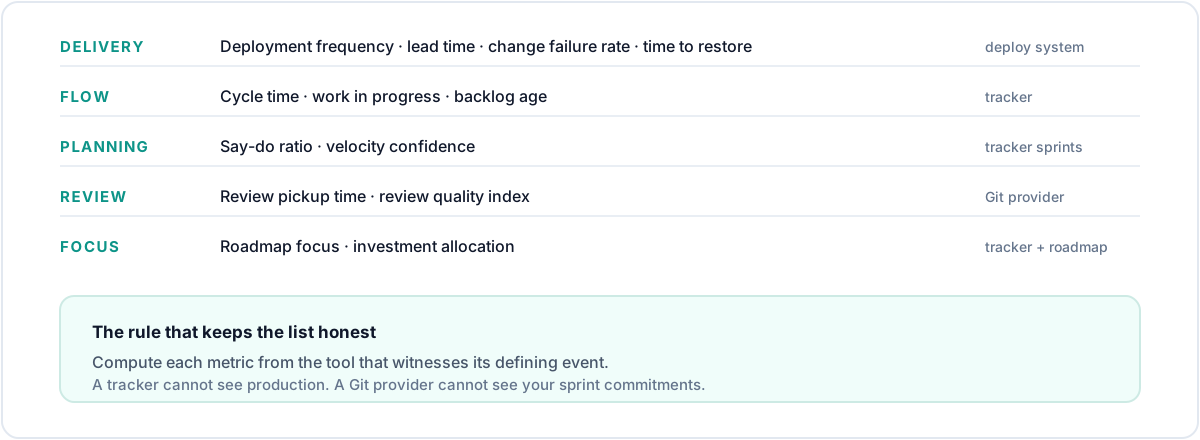
One rule keeps the whole list honest: compute each metric from the tool that witnesses its defining event — deploys from the deploy system, waits from the tracker, reviews from the Git provider. That is the architectural premise of Deckgauge: it connects Jira or Azure Boards, GitHub or GitLab, and Azure DevOps Pipelines/Releases, read-only, and labels every proxy as a proxy.