Reference
Engineering metrics glossary: what each one measures, and what it doesn't
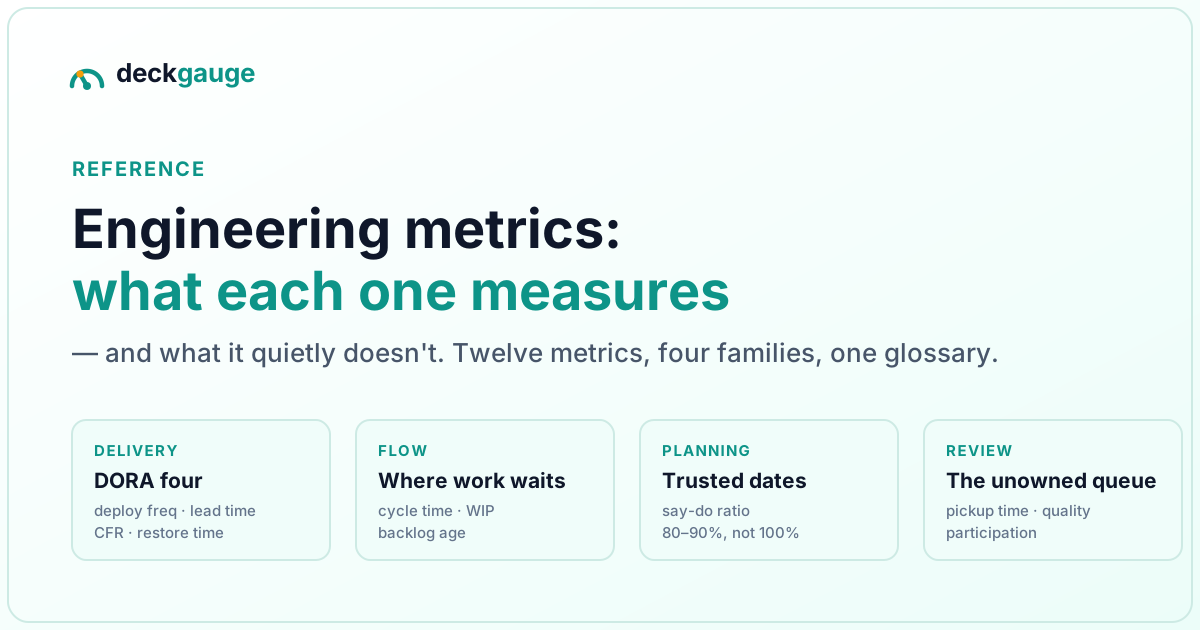
The short version.
- Every engineering metric answers one question. The glossary's job is to keep you from answering the wrong one.
- Four families cover almost everything: delivery (DORA), flow (cycle time, WIP, backlog age), planning (say-do ratio), review (pickup time, review quality).
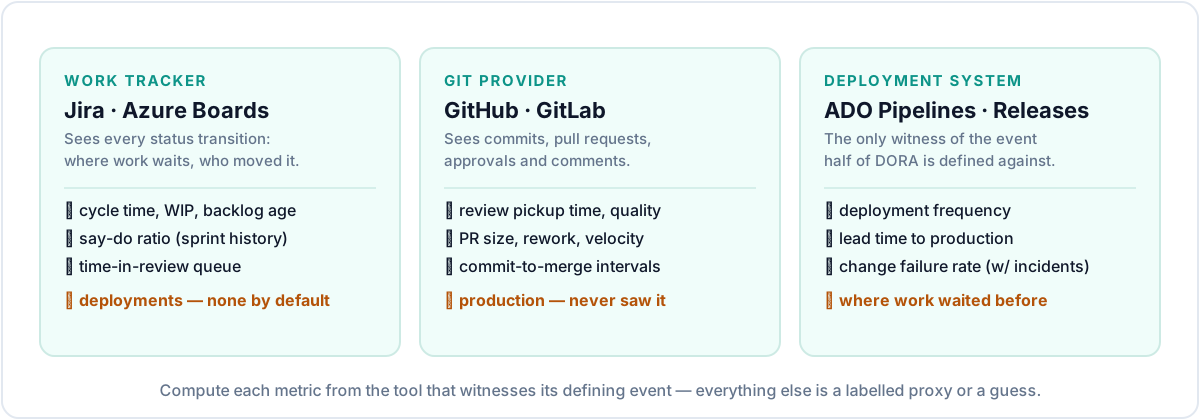
- Each metric is only honest if computed from the tool that actually witnesses its defining event — deploys come from the deploy system, never from a ticket board.
- Metrics that rank individual engineers measure the wrong unit and are trivially gamed. Measure the system of work.
"Engineering metrics" gets searched millions of times a year and most of what it returns is a vendor dashboard screenshot. This page is the opposite: the definitions, what each metric genuinely tells you, what it quietly hides, and which tool's data it needs — so you can build a small set that answers real questions.
The glossary at a glance
| Metric | What it measures | What it doesn't | Data it needs |
|---|---|---|---|
| Deployment frequency | How often changes reach production | Whether those changes were any good | Deployment records |
| Lead time for changes | Commit (or PR) to running in production | Backlog and planning time before the commit | Git + deployments |
| Change failure rate | Share of deploys causing a failure needing a fix or rollback | Severity of the failure | Deployments + incidents |
| Time to restore service | How long recovery takes after a bad deploy | How the incident was actually handled | Incidents |
| Cycle time | Work started → work finished | Time waiting before work started | Tracker transitions |
| Lead time (flow) | Created → delivered, waiting included | How much effort was inside the elapsed time | Tracker transitions |
| Work in progress | Items open and being worked right now | Whether any item is close to done | Tracker |
| Backlog age | How long unstarted items have waited | Whether they should ever be started | Tracker |
| Say-do ratio | Share of sprint commitments actually delivered | Effort or value of the work | Tracker (sprint history) |
| Review pickup time | How long a PR waits before first review | Review quality | Git provider |
| Review quality | Genuine approvals, real comments, not instant merges | Whether the code was correct | Git provider |
| Review participation | Spread of reviewing across the team | Reviewer skill | Git provider |
Delivery metrics: the DORA four
The four DORA metrics — deployment frequency, lead time for changes, change failure rate, time to restore service — measure the delivery system end to end. Their defining event is reaching production, which only your deployment system witnesses. A tracker board has no deployment data by default; a Git provider holds commits and pull requests but, without a connected deployment record, cannot tell you when anything ran in production. Dashboards that paper over this invent a proxy (a merge is "a deploy") and quietly redefine the metric.
Proxies are not disqualifying if they are labelled — a lead time measured from PR open instead of first commit is still useful, as long as the label says so. We go deeper on this per tool: Azure DevOps, Jira, GitHub, GitLab — each guide covers exactly what that tool can and cannot supply.
Flow metrics: where work waits
Cycle time, work in progress and backlog age come from the tracker, because the tracker records every status transition with a timestamp. The relationship that makes them worth tracking is close to mechanical: hold throughput steady and cycle time rises with WIP — more items in flight means each waits longer for attention. Rising WIP with flat throughput is the earliest visible sign a team is drowning, weeks before anything shows in delivery metrics.
The gap between lead time and cycle time is queue time, and queue time is usually the fixable part: work waiting for refinement, waiting for review, waiting for an environment. The WIP widget and backlog age widget in Deckgauge exist precisely because these two numbers are cheap to compute and almost never watched.
Planning metrics: can the dates be trusted
The say-do ratio is the flagship: what percentage of what a team committed to at sprint start actually shipped by sprint end. A sustained 80–90% is healthy — sustained 100% means sandbagged commitments, not perfect delivery. It is a forecasting metric: it tells stakeholders whether the team's word can be scheduled around, which no delivery or flow metric does.
Planning metrics fail when attached to individuals. The moment a say-do number lands in someone's performance review, the rational move is to commit to less — the metric improves while the organisation ships less. Same family, same failure mode as individual velocity rankings.
Review metrics: the queue nobody owns
Review pickup time (PR open to first review) and review quality — genuine peer approvals, written comments, the share of merges that happened suspiciously fast — measure the only queue in engineering that appears on no one's job description. Review delay is pure lead-time addition with no offsetting benefit, and rubber-stamped approvals quietly delete the safety review exists to provide. The Review Quality Index reads these from your Git provider's own records.
Metrics to avoid
- Lines of code, commit counts, ticket closes per person. Output counted per individual measures the wrong unit, is trivially gamed, and ranking engineers by it is a works-council and GDPR problem in much of Europe.
- Utilisation. Busy is not delivering; high utilisation is how you guarantee queueing.
- Velocity compared across teams. Points are local currencies; exchange rates do not exist.
- Any metric nobody has ever changed a decision because of. It will be cancelled in the next budget review, taking the useful ones with it.
For the full argument, see DORA metrics without gaming them and measuring engineers without surveillance.
Where the data lives
One rule prevents most bad metrics: compute each metric from the tool that witnesses its defining event. The tracker sees waits and status transitions. The Git provider sees commits, pull requests and reviews. The deployment system alone sees production. That is the entire architectural premise of Deckgauge — it connects Jira or Azure Dev Boards, GitHub or GitLab, and Azure DevOps Pipelines/Releases, and computes each metric from the source that can actually see it, read-only, with proxy fallbacks labelled as proxies. If a dashboard cannot tell you which source a number came from, it is guessing.
Frequently asked
- What are engineering metrics?
- Quantitative measures of how software gets built: how fast changes reach production, how much work is in flight, how long reviews take, whether plans survive contact with the sprint. They come from data your tools already generate — the tracker, the Git provider, the deployment system — and they describe the system of work, not the worth of individual engineers.
- How many engineering metrics should a team track?
- Fewer than most dashboards show. One or two per question you actually act on: are we shipping smoothly (lead time, deploy frequency), are we stable (change failure rate), is work flowing or piling up (WIP, cycle time, backlog age), can our dates be trusted (say-do ratio). A metric nobody has changed a decision because of is decoration, and decoration is what gets measurement programmes cancelled.
- What is the difference between cycle time and lead time?
- Cycle time is work started to work finished — how long an item was actually being worked. Lead time is request created to delivered, including all the waiting. Lead time is always longer, and the gap between the two is queue time, which is usually where the fixable problem lives. DORA lead time for changes is a third thing entirely: first commit to running in production.
- Which engineering metrics should you NOT track?
- Output counted per individual: lines of code, commit counts, ticket closes, individual velocity rankings. They measure the wrong unit (people instead of the system of work), they are trivially gamed, and in much of Europe ranking engineers by them runs into works-council and GDPR constraints. Track the flow of work, not the output of named humans.
- Where does the data for engineering metrics come from?
- Three places, and each sees a different slice. The work tracker (Jira, Azure DevOps Boards) records every status transition — it knows where work waits. The Git provider (GitHub, GitLab) holds commits, pull requests and reviews — it knows what code happened. The deployment system (Azure DevOps Pipelines/Releases, GitLab CI) is the only thing that witnesses production. Most bad dashboards come from computing a metric from a tool that cannot see its defining event.
If you're building a measurement programme, the natural next reads are how to measure engineering productivity and what belongs on a DORA dashboard.