The dashboard
DORA metrics dashboards: what belongs on one, and what each panel needs
The short version.
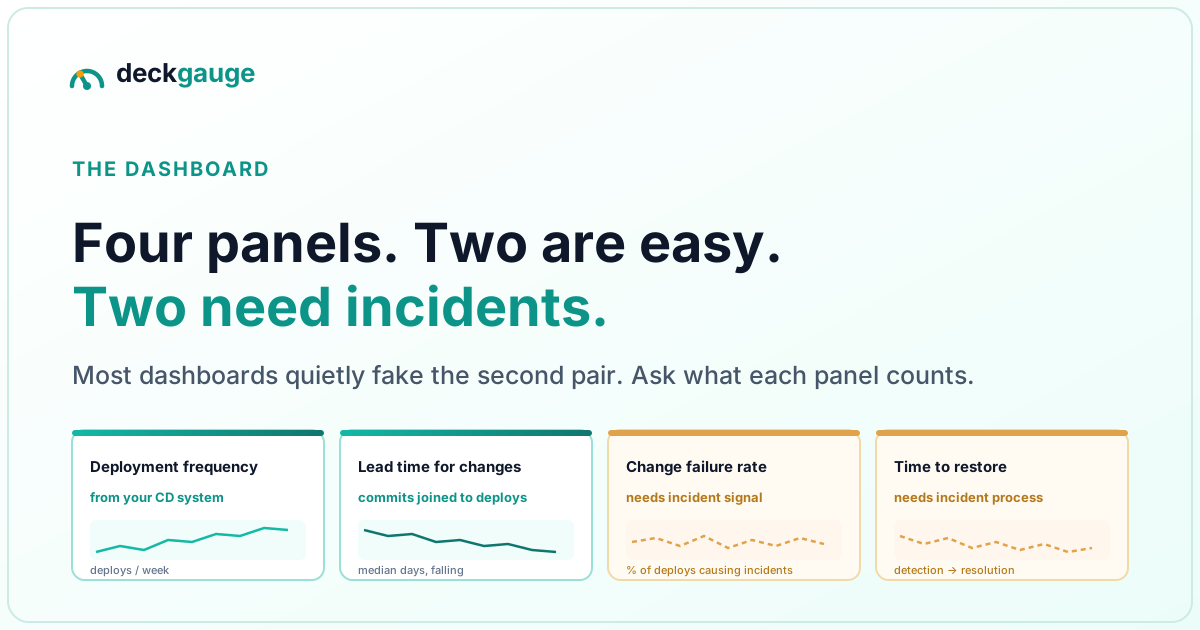
- A DORA dashboard is four panels — deployment frequency, lead time, change failure rate, time to restore — each with a trend line and a source label.
- Two panels come from your CD system. Two need an incident signal most teams haven't wired up. Most dashboards quietly fake the second pair.
- The question to ask any tool: what is this number built from, and what happens when the source is missing?
- Trends beat snapshots. A DORA number is only meaningful against the same team's own past.
- Team level, never individual — the metrics were designed for systems, and break when aimed at people.
Four panels, and where each one's data lives
Everything on a DORA dashboard is a join across tools you already run. The honest version starts by naming the source of each panel, because that is what determines whether the number is a measurement or a guess:
| Panel | Source | What it needs to be true |
|---|---|---|
| Deployment frequency | CD system — pipelines, releases, deploy jobs | A written definition of which environments count as production |
| Lead time for changes | Repo (commit timestamps) joined to deploys | Deploy records that carry the commits they shipped |
| Change failure rate | Incidents joined to deployments | An incident signal your team actually maintains |
| Time to restore service | Incident open/close timestamps | Same — opened at detection, closed at resolution |
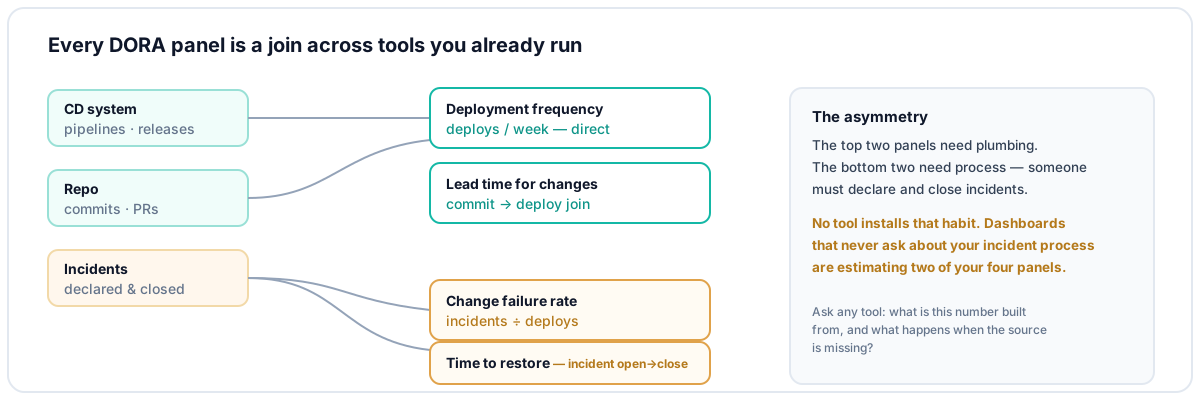
Notice the asymmetry. The top two panels need plumbing — a deployment record you can query, a join you can run. The bottom two need process: someone must declare incidents, timestamp them, and link them to the deploy that caused them. No tool installs that habit. This is why the market is full of dashboards where the top half is real and the bottom half is a proxy wearing a chart.
The proxy-substitution traps
Every DORA dashboard vendor faces the same pressure: the customer wants four panels on day one, and two of them are structurally unavailable. The substitutions that follow:
- Pipeline failure rate standing in for change failure rate. A red build never reached production — counting it as a "change failure" measures your build system, not your delivery. It will read healthy the same week you had three production incidents.
- Merge-to-deploy standing in for commit-to-production. Smaller number, different definition. Fine if labelled; misleading if the comparison chart next quarter uses the other one.
- Ticket throughput standing in for deployment frequency. Counting "Done" tickets counts activity, not shipping — a team can close a thousand tickets between releases.
None of these substitutions is dishonest on its own — each is a real metric with a real use. The dishonesty is in the label. Before trusting any DORA dashboard, find out what each panel counts; a tool that cannot tell you, or that shows all four confidently without ever asking about your incident process, is estimating two of them.
The test we hold ourselves to. On Deckgauge's DORA dashboard, lead time runs from PR open to the production deploy that shipped the change — or to merge, labelled as a proxy, where a repository records no deploys. Where deployment or incident sources are not connected, deployment frequency, change failure rate and time to restore are derived and labelled as proxies on the widget rather than presented as measurements. The four panels are graded against the report's roughly Elite/High/Medium/Low clusters. We would rather show you an honest estimate with a warning than a confident number we cannot substantiate — the same rule this post is asking you to apply to every dashboard you evaluate, including ours.
Trends, tiers, and how to actually read it
The DORA research clusters teams into performance tiers — roughly: elite teams deploy multiple times a day with lead times under an hour; low performers deploy monthly or less with lead times measured in months. The bands shift between reports and the clusters overlap, so treat them as orientation, not targets. What acts on delivery is the team's own trend line: deployment frequency climbing over a quarter of pipeline work, lead time falling as batches shrink. A dashboard without history is a scoreboard without a game.
And the standing rule from the rest of this series: report at team level. The four metrics were designed to describe a delivery system. Aimed at individuals they generate gaming — small commits to juice frequency, incident under-reporting to juice the failure rate — and the numbers stop meaning anything. The quarterly version of that argument is in DORA metrics without gaming them.
Buying or building: the field, honestly
| Option | Good for | Where it hurts |
|---|---|---|
| Build in Grafana over your own data (or DevLake's panels) | Total control of definitions; free; you learn your own pipeline data | You own the joins, the incident linking and the upgrades forever |
| Commercial SaaS — Jellyfish, LinearB, Swarmia, DX, Datadog | Polished, supported, connector depth (GitHub-first especially) | Per-seat pricing, and your commit and incident history in a vendor cloud |
| Self-hosted product — Deckgauge | The four panels plus the board, flow and workload, on your infrastructure; proxies labelled as proxies | You run it. Deployment data today comes from Azure DevOps Pipelines/Releases — check the connector for your stack before committing |
Whatever row you pick, the evaluation question is identical: ask for one number on the demo dashboard and ask what it is built from. A vendor who answers precisely — including "that one's an estimate until you connect X" — has earned the rest of the demo.
Frequently asked
- What should a DORA metrics dashboard show?
- Four panels, honestly sourced: deployment frequency (production deployments per week, from your CD system), lead time for changes (commit to production, from your repo joined to deploys), change failure rate (share of deployments causing an incident, requires an incident signal), and time to restore service (incident detection to resolution). Plus a trend line for each — the four numbers are only meaningful against the team’s own past — and an explicit label wherever a panel is a proxy rather than a measurement.
- Where does the data for a DORA dashboard come from?
- Your existing tools. Deployments live in the CD system — Azure DevOps Pipelines/Releases, GitHub Actions environments, GitLab environments, or your deploy scripts. Commits and PRs live in the repo. Incidents live wherever your team declares them — PagerDuty, GitLab incidents, or a work-item type you discipline yourself to use. A DORA dashboard is a join across those, which is why bolting one onto a single tracker always shows less than the full picture.
- What is a good DORA dashboard tool?
- One that shows its sources and labels its proxies. The failure mode of DORA dashboards is quiet substitution: pipeline failure rate standing in for change failure rate, merge-to-deploy standing in for commit-to-production. A good tool states what each number is built from, flags panels whose source is missing, and reports at team level rather than ranking individuals. Commercial options include Jellyfish, LinearB, Swarmia and DX; self-hosted options include Apache DevLake (database plus Grafana) and Deckgauge.
- How often should you look at a DORA dashboard?
- Weekly for the trend, monthly for the conversation. The metrics move slowly by construction — deployment frequency shifts over weeks of pipeline work, not after one good standup. Teams that put DORA on a big screen watch noise; teams that review the month-over-month trend in a retrospective act on signal.
The tracker-by-tracker companion series — where each source system holds the data, and where it structurally doesn't: Azure DevOps, Jira, GitHub, GitLab.